010_flattened_sweep_cross_section : Flattened Sweep & Cross Section Markers
Requires: SmartSpice & Smartview
Minimum Versions: SmartSpice 4.18.16.R and SmartView 2.32.5.R
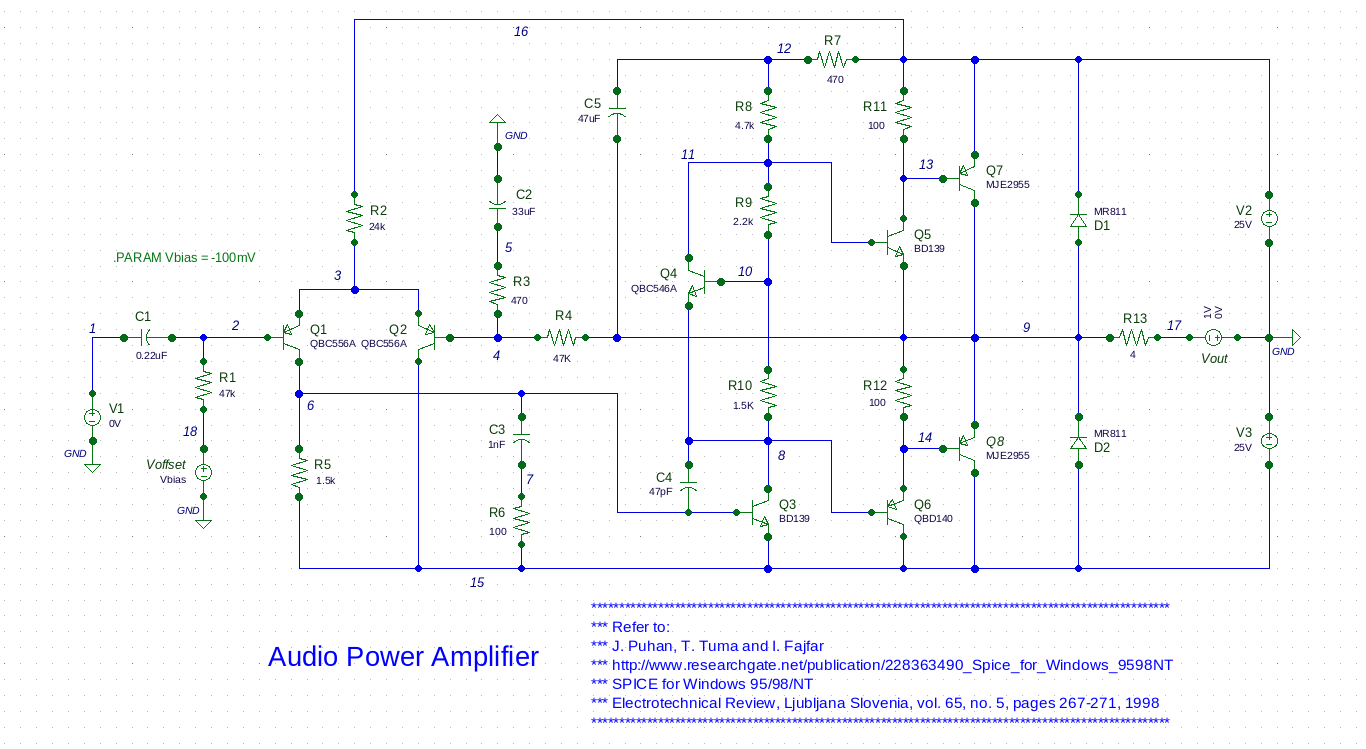
This example demonstrates crossover compensation and output impedance characterization of an Audio Power Amplifier circuit (reference "J. Puhan, T. Tuma, I. Fajfar, SPICE for Windows 95/98/NT, Electrotechnical Review, Ljubljana Slovenia, vol. 65, no. 5, page 267-271, 1998"). The example illustrates the techniques used to generate Figures 2, 3, and 5 of Puhan et al. using built-in SmartSpice and SmartView features.
Important SmartSpice and SmartView features demonstrated in this example include the following:
- Automatically generating a RAW file to store the simulation results (.OPTIONS POST).
- Using PARAMETRIC_DATA_IN_RAW to store .PARAM values as the parameter is varied with SWEEP.
- Enabling FLATTENED_SWEEP for Cross Section Marker calculations in SmartView.
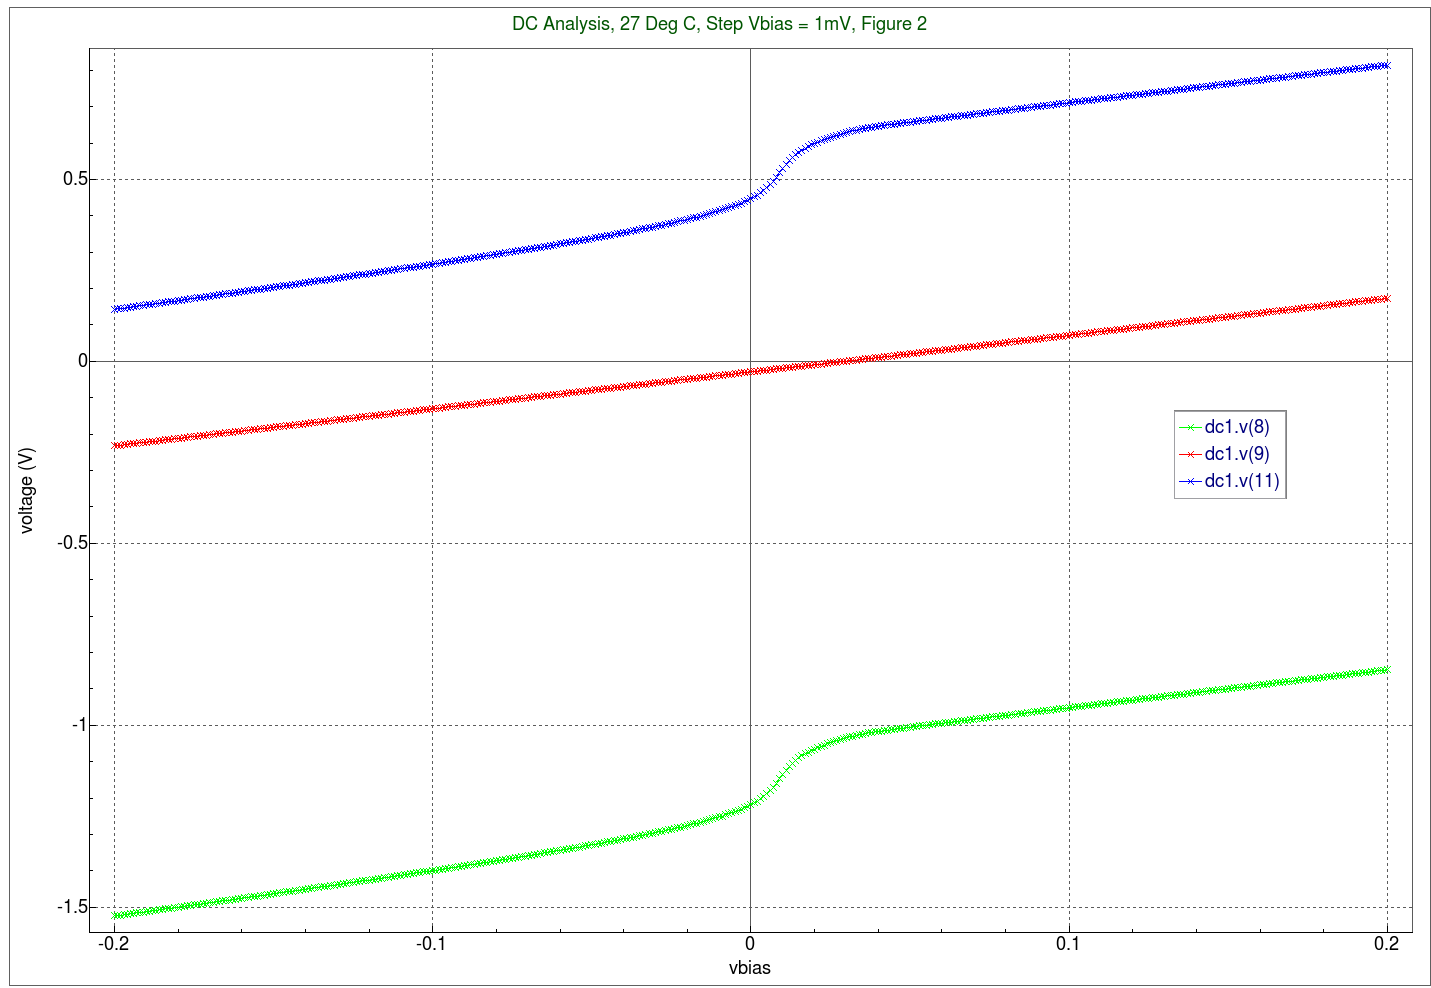
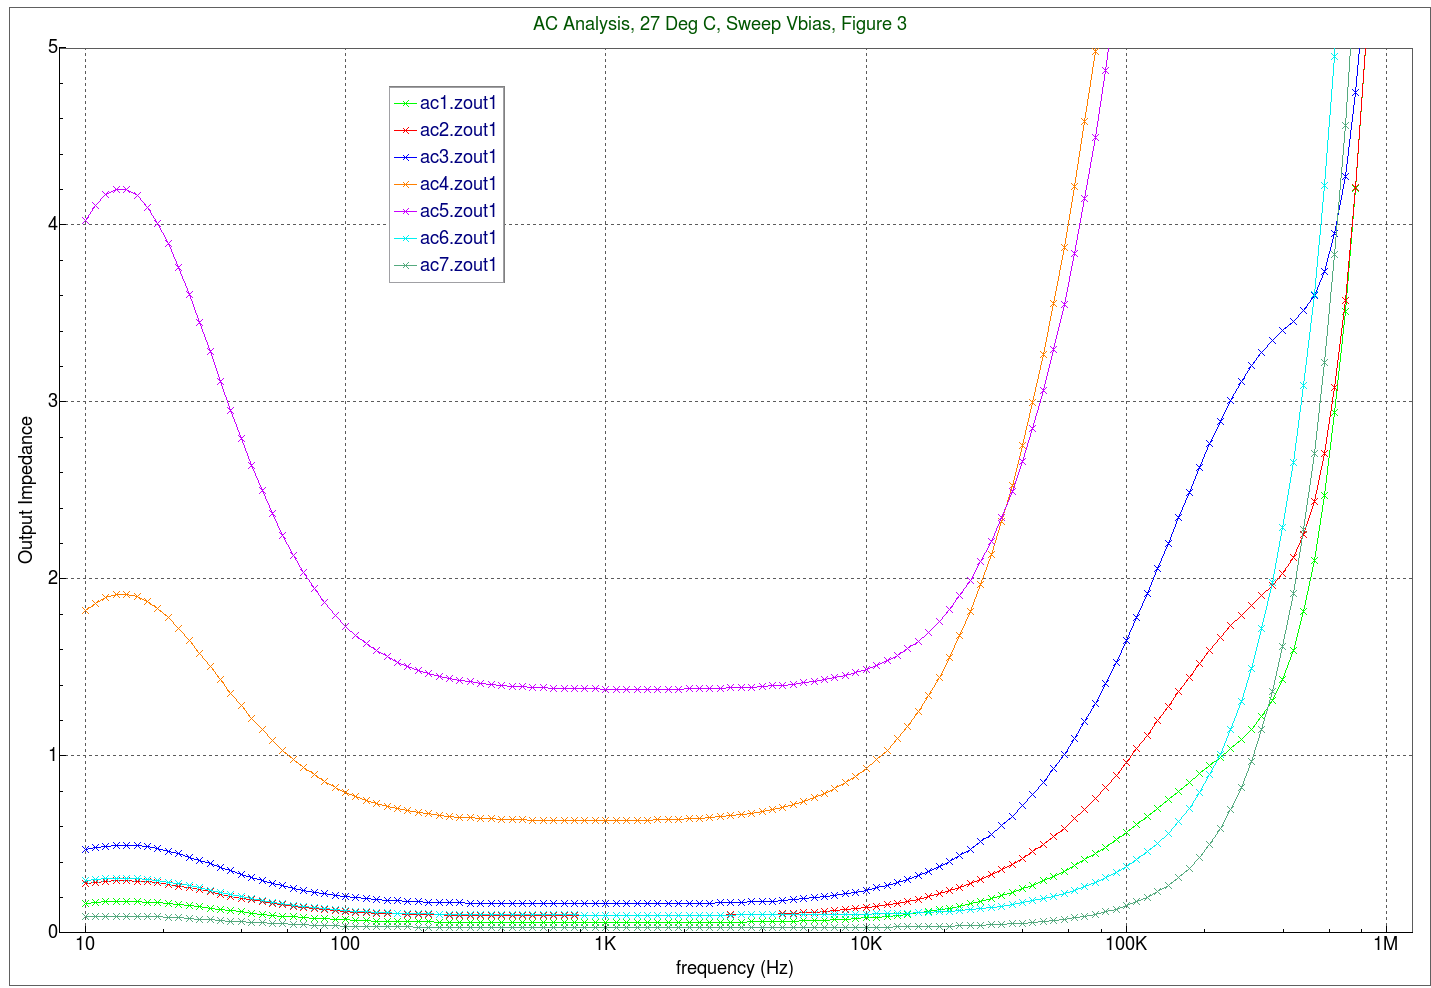
The input deck for Figure 2 and 3, a common netlist, and the model files are used to characterize crossover compensation (.DC analysis for Figure 2) and measure Output Impedance versus Frequency (.AC analysis with .LET calculation for Figure 3) at a few, pre-selected input offset voltages (Vbias). The CROSSOVER COMPENSATION and OUTPUT IMPEDANCE versus FREQUENCY results demonstrate these concepts.
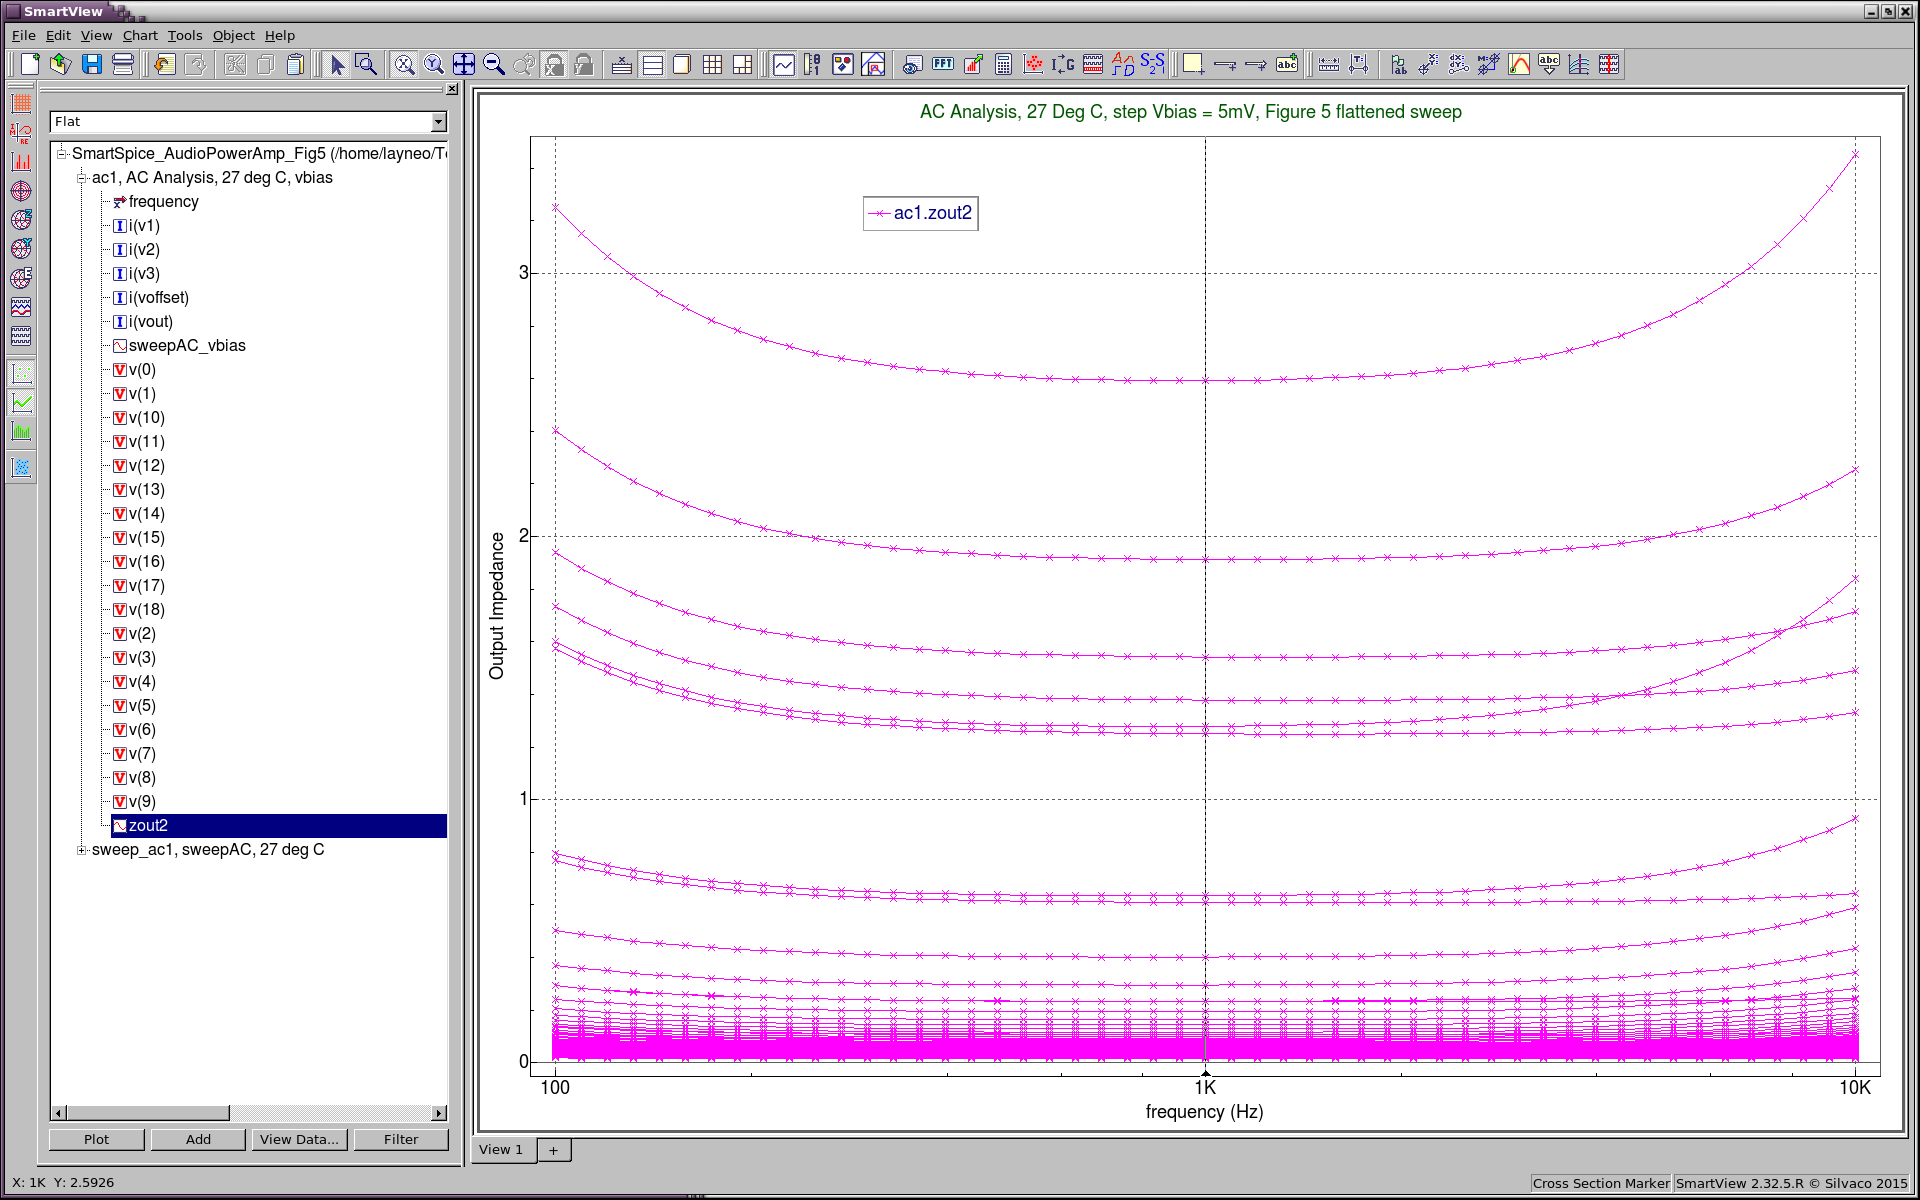
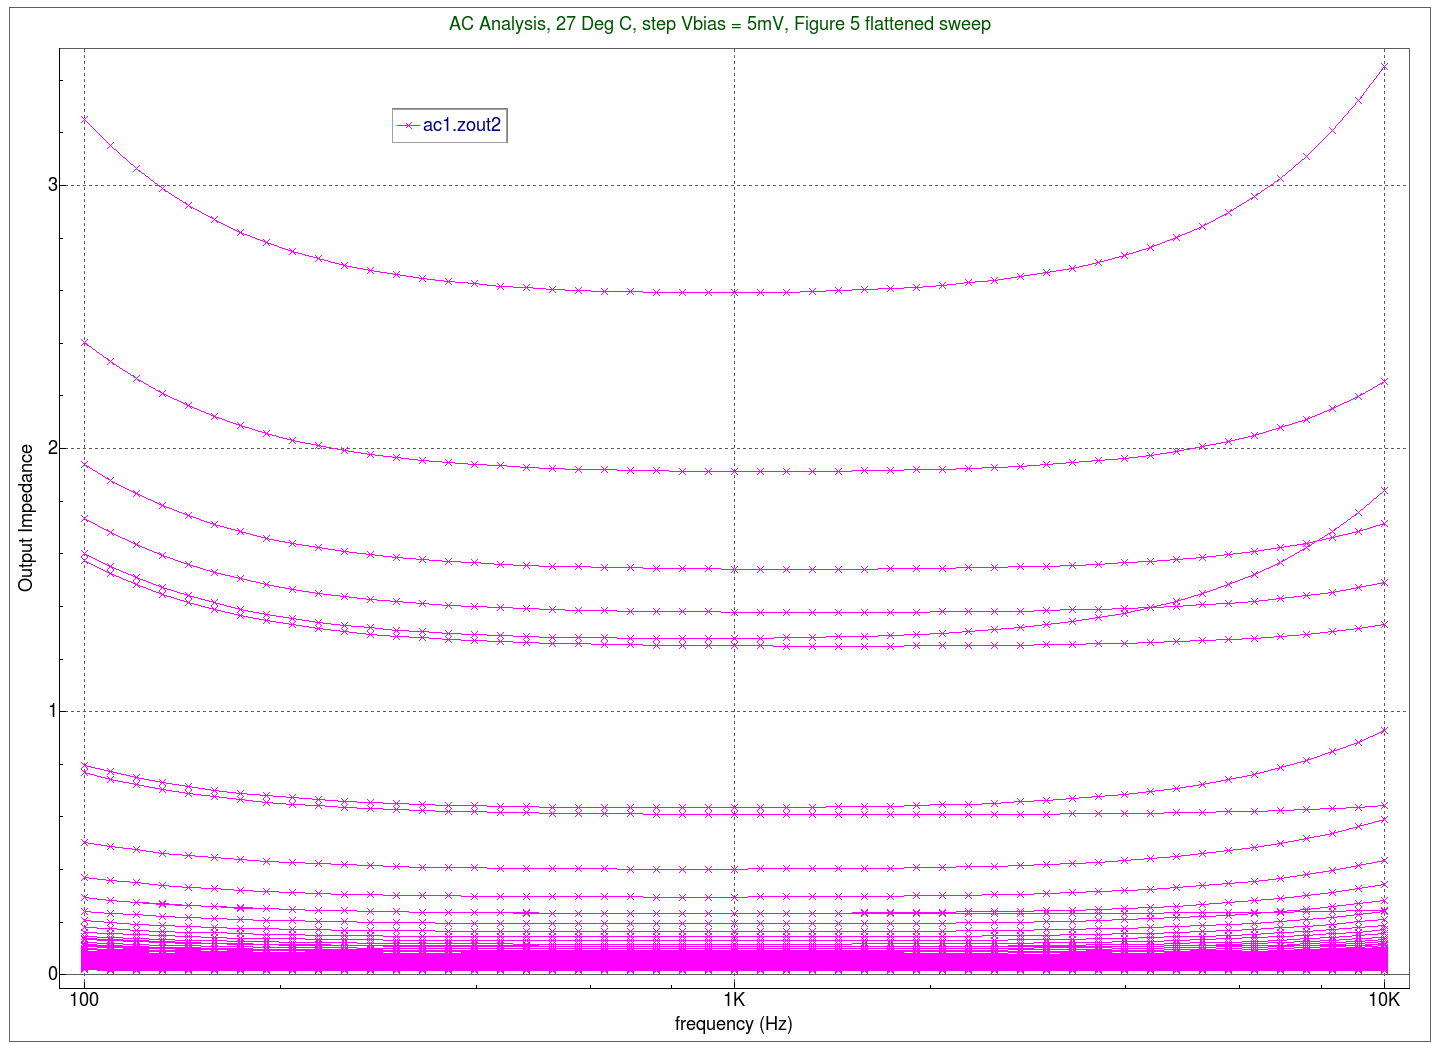
The input deck for Figure 5is used to characterize and measure Output Impedance versus Frequency (.AC analysis with .LET calculation) at many input offset voltages (Vbias).
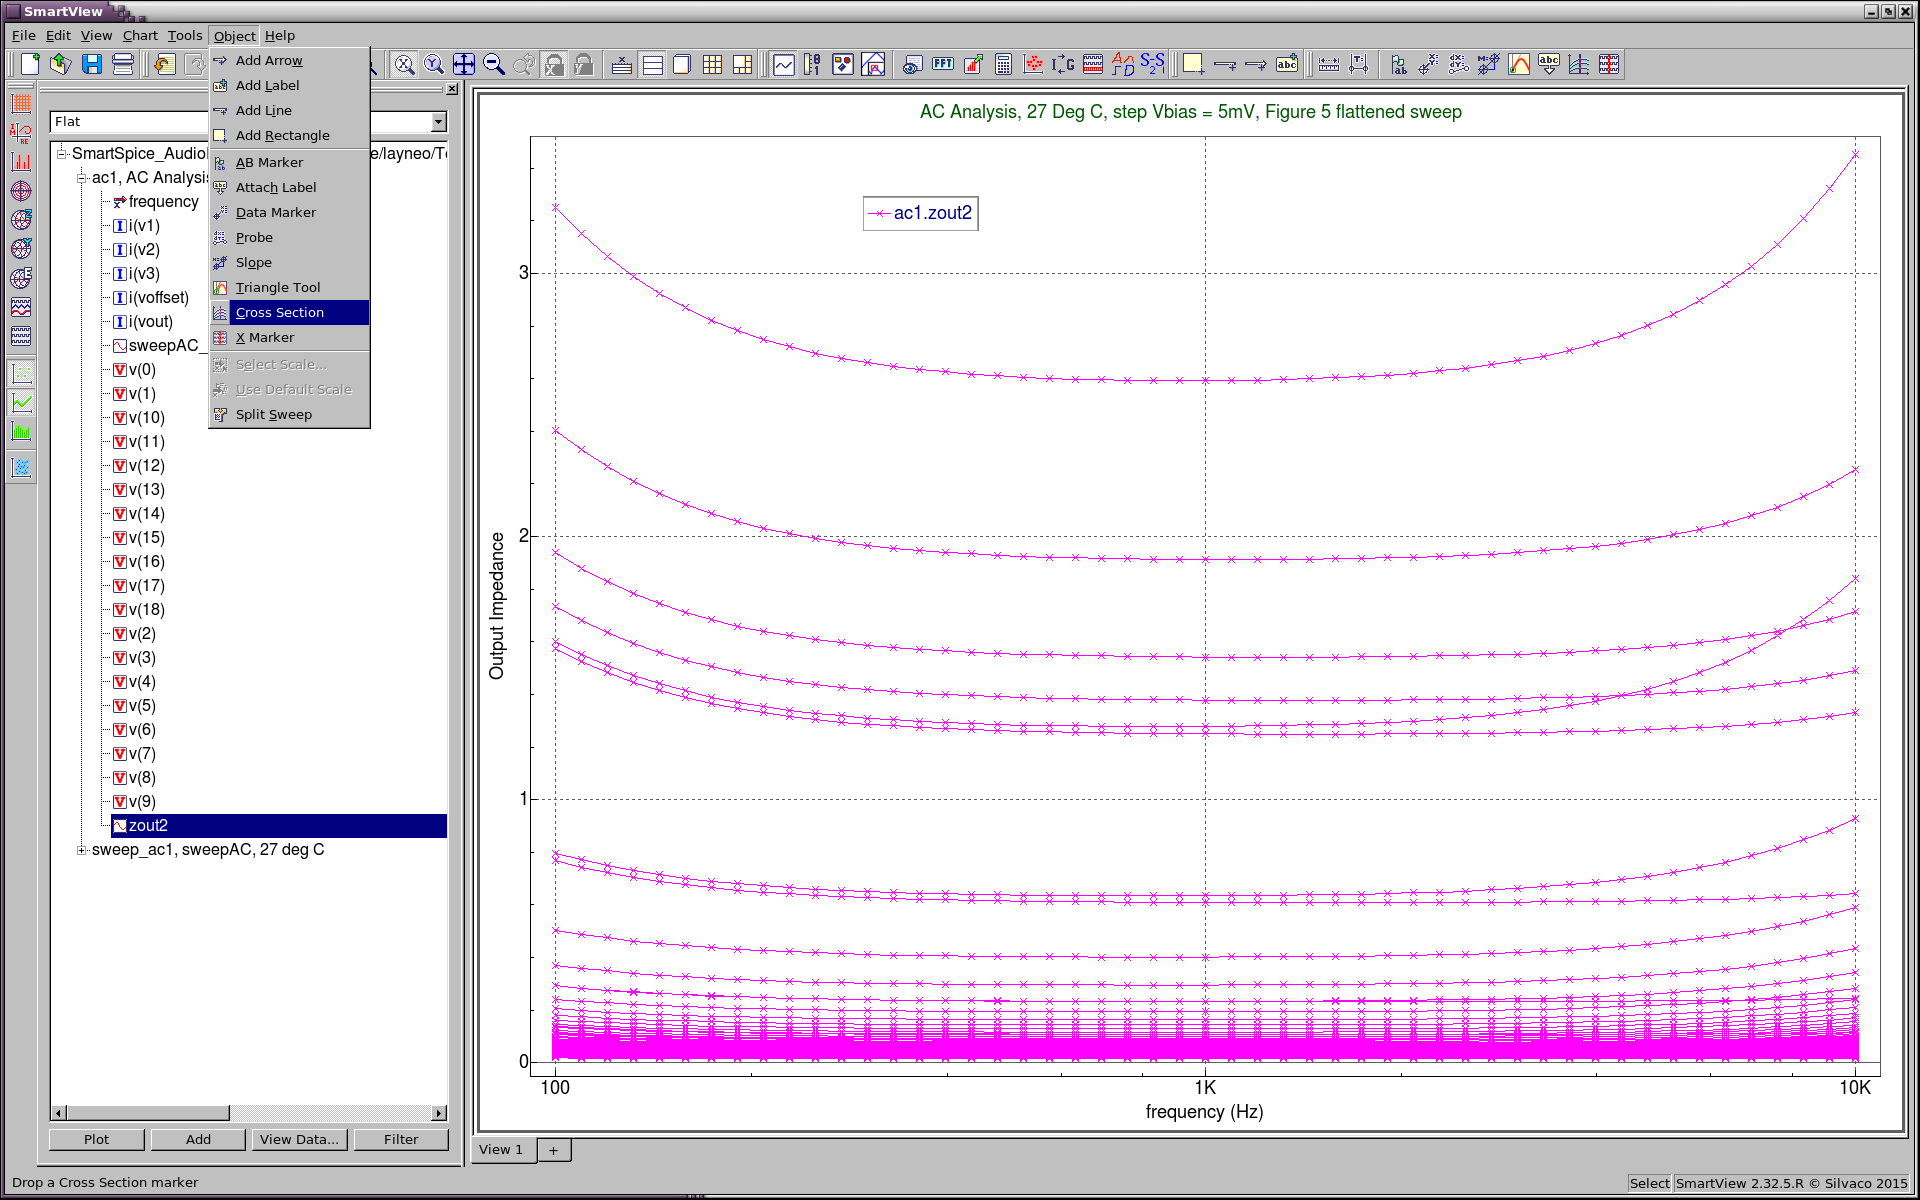
As noted in Puhan et al., when the number of data points specified in the SWEEP becomes large, visual analysis can become manually cumbersome. By enabling FLATTENED_SWEEP and PARAMETRIC_DATA_IN_RAW from the .CONTROL block, these multiple variations in offset voltage are flattened into a single vector for each Vbias step. The single, flattened vector becomes much easier to manipulate and work with in the SmartView application.
The flattened OUTPUT IMPEDANCE versus FREQUENCY result demonstrates this SmartSpice feature.
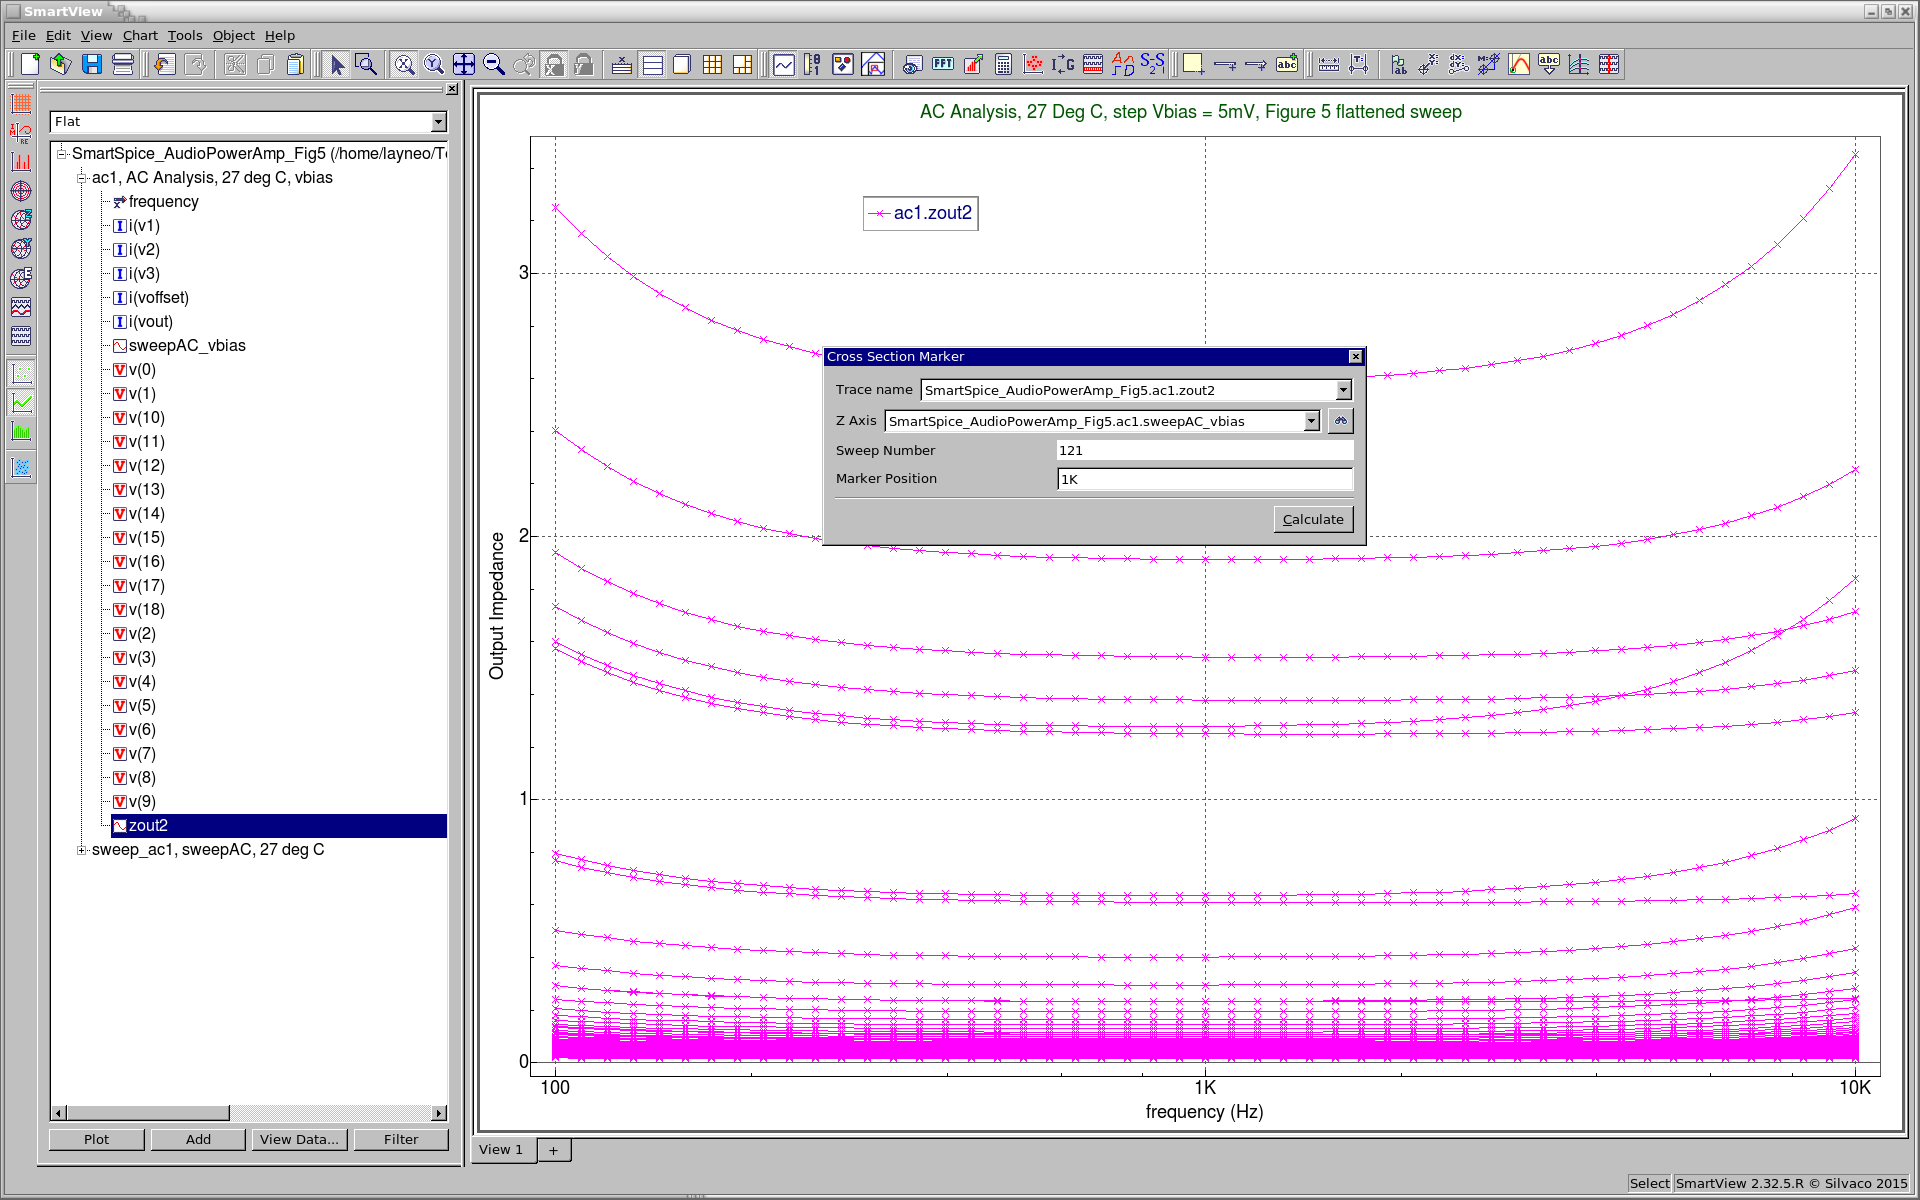
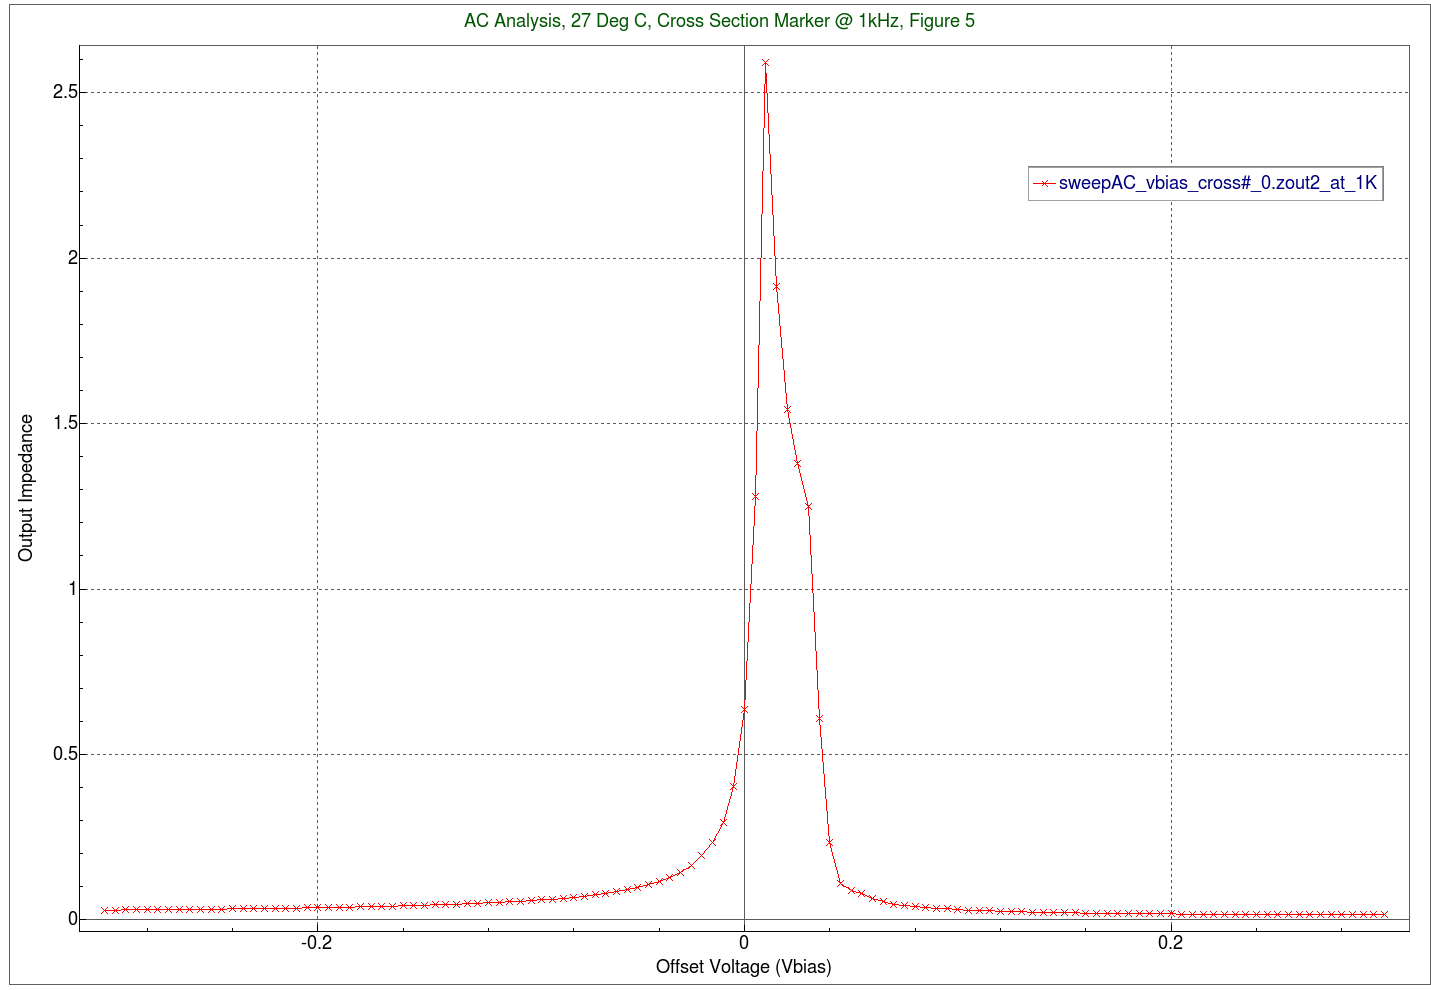
By using SmartView to open the RAW file produced by Figure 5 input deck's simulation, a Cross Section Marker is placed at 1KHz . Clicking the "Calculate" button in the Cross Section Marker pop-up window generates the OUTPUT IMPEDANCE versus INPUT OFFSET (Vbias) result (Figure 5 of Puhan et al.). Detailed instructions for generating the Cross Section Marker plot are outlined in the Figure 5 input deck.
SmartSpice_AudioPowerAmp_Fig2_Fig3.in
											*** Audio Power Amplifier

***********************************************************
*** Control
***********************************************************
.CONTROL
    set flattened_sweep=false
    set parametric_data_in_raw=false
.ENDC

***********************************************************
*** Netlist
***********************************************************
.INCLUDE 'SmartSpice_AudioPowerAmp_netlist.txt'

***********************************************************
*** Figure 2: Cross-over Compensation
***
***           - Load and run simulation
***           - Plot => v(8), v(9), v(11) VERSUS vbias
***********************************************************
.DC Vbias -200mV 200mV 1mV

***********************************************************
*** Figure 3: Output Impedance versus Frequency
***
***           - Load and run simulation
***           - Plot => zout1 VERSUS frequency
***********************************************************
.AC DEC 25 10Hz 1MegHz SWEEP Vbias
+ LIST 7 -100mV -50mV -25mV 0mV 25mV 50mV 100mV
.LET AC Zout1 = MAG( V(9) / I(Vout) )

.END
SmartSpice_AudioPowerAmp_Fig5.in
											*** Audio Power Amplifier

***********************************************************
*** Control
***********************************************************
.CONTROL
    set flattened_sweep=true
    set parametric_data_in_raw=true
.ENDC

***********************************************************
*** Netlist
***********************************************************
.INCLUDE 'SmartSpice_AudioPowerAmp_netlist.txt'

***********************************************************
*** Figure 5: Output Impedance versus Input Offset Voltage
***
***           - Load and run simulation
***           - Click "Start Waveform Viewer" button
***           - Open "SmartSpice_AudioPowerAmp_Fig5.raw" in SmartView
***           - Plot => zout2 versus frequency
***           - Click "Cross Section Marker" and set @ 1kHz
***           - Cross Section Marker pop-up setup
***                Trace Name = SmartSpice_AudioPowerAmp_Fig5.ac1.zout2
***                Z Axis = SmartSpice_AudioPowerAmp_Fig5.ac1.sweepAC_vbias
***                Sweep Number =  sweepAC_vbias_cross#_0.zout2_at_1K versus sweepAC_vbias_scale#_0
***********************************************************
.AC DEC 25 100Hz 10kHz SWEEP Vbias -300mV +300mV 5mV
.LET AC Zout2 = MAG( V(9) / I(Vout) )

.END
SmartSpice_AudioPowerAmp_models.txt
											***********************************************************
*** Device models
***********************************************************

*** BJT Models
*** http://www.datasheetarchive.com/files/philips/models/bc556_557_3.html
*** http://www.datasheetarchive.com/files/philips/models/bc546_547_3.html
***
*.MODEL QBC556A PNP (
*+     IS=2.059E-14 NF=1.003 ISE=2.971E-15 NE=1.316 BF=227.3
*+     IKF=0.08719 VAF=37.2 NR=1.007 ISC=1.339E-14 NC=1.15
*+     BR=7.69 IKR=0.07646 VAR=11.42 RB=1 IRB=1E-06
*+     RBM=1 RE=0.688 RC=0.6437 XTB=0 EG=1.11
*+     XTI=3 CJE=1.4E-11 VJE=0.5912 MJE=0.3572 TF=7.046E-10
*+     XTF=4.217 VTF=5.367 ITF=0.1947 PTF=0 CJC=1.113E-11
*+     VJC=0.1 MJC=0.3414 XCJC=0.6288 TR=1E-32 CJS=0
*+     VJS=0.75 MJS=0.333 FC=0.7947 )

*.MODEL QBC546A NPN (
*+     IS=1.533E-14 NF=1.002 ISE=7.932E-16 NE=1.436 BF=178.7
*+     IKF=0.1216 VAF=69.7 NR=1.004 ISC=8.305E-14 NC=1.207
*+     BR=8.628 IKR=0.1121 VAR=44.7 RB=1 IRB=1E-06
*+     RBM=1 RE=0.6395 RC=0.6508 XTB=0 EG=1.11
*+     XTI=3 CJE=1.61E-11 VJE=0.4209 MJE=0.3071 TF=4.995E-10
*+     XTF=139 VTF=3.523 ITF=0.7021 PTF=0 CJC=4.388E-12
*+     VJC=0.2 MJC=0.2793 XCJC=0.6193 TR=1E-32 CJS=0
*+     VJS=0.75 MJS=0.333 FC=0.7762 )

*** BJT Models
*** http://ece.ut.ac.ir/Classpages/S92/ECE088/Model.txt
***
*.MODEL BD139 NPN (
*+ IS=1e-09 BF=222.664 NF=0.85 VAF=36.4079
*+ IKF=0.166126 ISE=5.03418e-09 NE=1.45313 BR=1.35467
*+ NR=1.33751 VAR=142.931 IKR=1.66126 ISC=5.02557e-09
*+ NC=3.10227 RB=26.9143 IRB=0.1 RBM=0.1
*+ RE=0.000472454 RC=1.04109 XTB=0.727762 XTI=1.04311
*+ EG=1.05 CJE=1e-11 VJE=0.75 MJE=0.33
*+ TF=1e-09 XTF=1 VTF=10 ITF=0.01
*+ CJC=1e-11 VJC=0.75 MJC=0.33 XCJC=0.9
*+ FC=0.5 CJS=0 VJS=0.75 MJS=0.5
*+ TR=1e-07 PTF=0 KF=0 AF=1 )

*.MODEL QBD140 PNP (
*+ IS=1e-09 BF=650.842 NF=0.85 VAF=10
*+ IKF=0.0950125 ISE=1e-08 NE=1.54571 BR=56.177
*+ NR=1.5 VAR=2.11267 IKR=0.950125 ISC=1e-08
*+ NC=3.58527 RB=41.7566 IRB=0.1 RBM=0.108893
*+ RE=0.000347052 RC=1.32566 XTB=19.5239 XTI=1
*+ EG=1.05 CJE=1e-11 VJE=0.75 MJE=0.33
*+ TF=1e-09 XTF=1 VTF=10 ITF=0.01
*+ CJC=1e-11 VJC=0.75 MJC=0.33 XCJC=0.9
*+ FC=0.5 CJS=0 VJS=0.75 MJS=0.5
*+ TR=1e-07 PTF=0 KF=0 AF=1 )


*** BJT Model
*** http://www.diyaudio.com/forums/solid-state/5493-pspice-models-2955-3055-a.html
***
*.MODEL MJE2955 PNP ( Is=66.19f Xti=3 Eg=1.11 Vaf=100 Bf=137.6 Ise=862.2f
*+ Ne=1.481 Ikf=1.642 Nk=.5695 Xtb=2 Br=5.88 Isc=273.5f Nc=1.24
*+ Ikr=3.555 Rc=79.39m Cjc=870.4p Mjc=.6481 Vjc=.75 Fc=.5
*+ Cje=390.1p Mje=.4343 Vje=.75 Tr=235.4n Tf=23.21n Itf=71.33
*+ Xtf=5.982 Vtf=10 Rb=.1 )

*** Junction Diode Model
*** http://www.datasheetarchive.com/files/spicemodels/misc/modelos/spice_complete/diode.lib
***
*.MODEL MR811 D ( IS=5.95E-08 N=2.180 BV=1.33E+02 IBV=1.00E-06
*+ RS=2.96E-02 CJO=2.39E-11 VJ=.75 M=.41 TT=5.04E-07 )

*** Ljubljana Models
*** http://www.macspice.com/eg/puhan/poweramp.cir
***
.model qbc556a pnp (is=20.3f nf=1 bf=123 vaf=161 ikf=.12 ise=16.4p ne=2
   + br=4 nr=1 var=16 ikr=.18 re=.257 rb=1.03 rc=.103 xtb=1.5
   + cje=54.3p vje=1.1 mje=.5 cjc=17.5p vjc=.3 mjc=.3 tf=618p tr=429n)
.model qbc546a npn (is=50.7f nf=1 bf=318 vaf=145 ikf=.3
   + ise=15.9p ne=2 br=4 nr=1 var=24 ikr=.45 re=1.54 rb=6.17
   + rc=.617 xtb=1.5 cje=20.8p cjc=8.33p tf=611p tr=138n)
.model bd139 npn (is=110f nf=1 bf=136 vaf=161 ikf=.5 ise=70.8p ne=2
   + br=4 nr=1 var=20 ikr=.75 re=.154 rb=.617 rc=61.7m xtb=1.5
   + cje=50.7p vje=.6 mje=.3 cjc=32.9p vjc=.22 mjc=.2 tf=13.2n tr=510n)
.model qbd140 pnp (is=110f nf=1 bf=130 vaf=161 ikf=.5 ise=74.3p ne=2
   + br=4 nr=1 var=20 ikr=.75 re=.154 rb=.617 rc=61.7m xtb=1.5
   + cje=111p vje=.6 mje=.3 cjc=72.5p vjc=.22 mjc=.2 tf=13.2n tr=510n)
.model mje2955 pnp (is=7.37e-13 nf=1.0 bf=156 vaf=139 ikf=2.0 ise=2.53e-10
   + ne=2.0 br=4 nr=1.0 var=28 xtb=1.5 re=1.5e-01 rb=5.9e-01 rc=5.9e-02
   + cje=1030p cjc=736p tf=4.0e-08 tr=7.6e-06 mje=.363 vje=.633 mjc=.361
   + vjc=.542)
.model mr811 d (is=5.95e-08 n=2.180 bv=1.33e+02 rs=2.96e-02 cjo=2.39e-11
   + vj=.75 m=.41 tt=5.04e-07)
SmartSpice_AudioPowerAmp_netlist.txt
											***********************************************************
*** Refer to:
*** J. Puhan, T. Tuma and I. Fajfar
*** http://www.researchgate.net/publication/228363490_Spice_for_Windows_9598NT
*** SPICE for Windows 95/98/NT
*** Electrotechnical Review, Ljubljana Slovenia, vol. 65, no. 5, pages 267-271, 1998
***********************************************************

***********************************************************
*** Options
***********************************************************
.OPTIONS POST

***********************************************************
*** Parameters
***********************************************************
.PARAM Vbias = -100mV

***********************************************************
*** Netlist
***********************************************************

V1 1 0 DC 0V
V2 16 0 DC 25V
V3 15 0 DC -25V
Vout 0 17 DC 0 AC 1
Voffset 18 0 DC Vbias

C1 1 2 0.22uF
C2 5 0 33uF
C3 7 6 1nF
C4 6 8 47pF
C5 9 12 47uF

R1 2 18 47k
R2 3 16 24k
R3 4 5 470
R4 4 9 47k
R5 6 15 1.5k
R6 15 7 100
R7 12 16 470
R8 12 11 4.7k
R9 11 10 2.2k
R10 10 8 1.5k
R11 16 13 100
R12 9 14 100
R13 9 17 4

Q1 6 2 3 QBC556A
Q2 15 4 3 QBC556A
Q3 8 6 15 BD139
Q4 11 10 8 QBC546A
Q5 13 11 9 BD139
Q6 15 8 14 QBD140
Q7 9 13 16 MJE2955
Q8 15 14 9 MJE2955

D1 9 16 MR811
D2 15 9 MR811

***********************************************************
*** Device models
***********************************************************
.INCLUDE 'SmartSpice_AudioPowerAmp_models.txt'
010_flattened_sweep_cross_section
[an error occurred while processing this directive]