001_full_flow : Full Flow Example
This example demonstrates running Guardian Design Rule Checking on a layout in the Expert interactive layout environment, and viewing any violations found.
Requires : Expert, Guardian
Minimum Version
: Expert 4.14.0.R, Guardian 4.14.0.R
You will also need to download, from this example's web page, the two data files: drc_full_flow_28.eld (the design database) and drc_full_flow_28.dsf (the DRC script).
1. Opening the layout in Expert
First start the Expert layout editor program, either with the command expert or by clicking the expert icon.
From the main menu bar at the top, click File->Open to open the Load Project menu, navigate to the directory into which the drc_full_flow_28.eld design database file was downloaded and Open it.
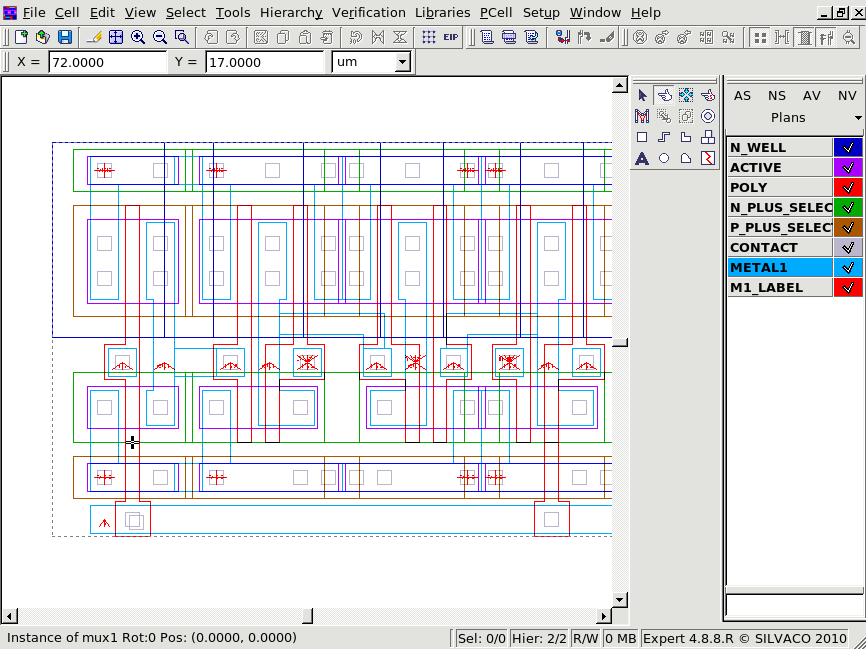
This will call up the Open Cell(s) menus, and here double-click mux4 , the top-level cell. By default this shows the hierarchical view of the design; you can see the full details by clicking View->Cell View->Flat .
See Figure1
2. Setting up DRC
The next step is to load the DRC script (also known as deck or runset). From the main Expert menu, click Verification->DRC->DRC script panel. This pops up the DRC Script Panel , and in here click File->Open to open the Select DRC Script File(s) menu, navigate to the directory into which the drc_full_flow_28.dsf DRC script file was downloaded and Open it. The DRC script is then shown in the DRC Script Panel .
See Figure2
3. Running DRC
You can enable progress bars, to monitor progress of the run, from the DRC Script Panel with Setup->Current DRC script run preferences... and in the popup window check Script progress bar and Command progress bar. If the progress bars are not enabled you will instead see a timer icon while the DRC is running.
The Setup->Current DRC script run preferences... menu also contains further options to customize the run, for example to limit the number of errors output or show the run log.
To run DRC, click DRC->Run in the DRC Script Panel
4. Selecting and Loading DRC Results
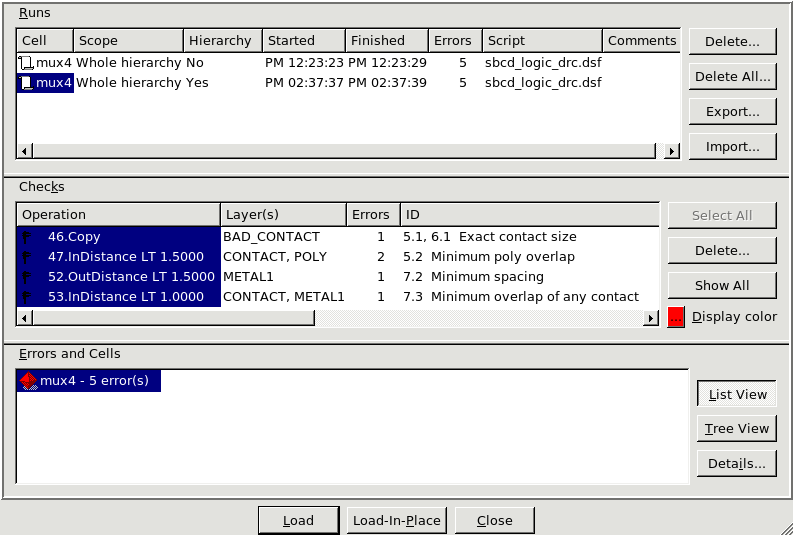
After DRC has been run, any DRC violations found can be viewed interactively on top of the original layout in Expert. From the Expert main menu, first load the DRC results into the Expert layout database with Verification->DRC->Errors->Load Errors. This opens the Load DRC Errors menu.
See Figure3
The first panel, Runs , in the Load DRC Errors menu shows one line for every time you have run DRC. Normally you will only be interested in the latest run, but it can be useful to see and compare the results from previous runs, for example to check that any fixes made to the layout have been successful. You can delete any previous runs that are no longer of use.
The second panel, Checks , shows a list of the individual DRC rule checks for the selected DRC run. By default it only shows rule checks which found errors, but clicking Show All will show every rule check done, even if it did not find any errors. If there are only a few errors found you can click Select All so that all the errors will be shown on the layout together, however if there are a lot of errors this can make it difficult to view individual errors, so you can select specific errors and look at them one at a time.
The final panel in Load DRC Errors is Errors and Cells. This allows further refinement of the error viewing when hierarchical error report is selected, but is not used in this example.
After selecting the required errors to view, click Load at the bottom of the Load DRC Errors panel; this loads the selected DRC errors into the layout database and they can now be viewed on the layout.
5. Viewing DRC Results
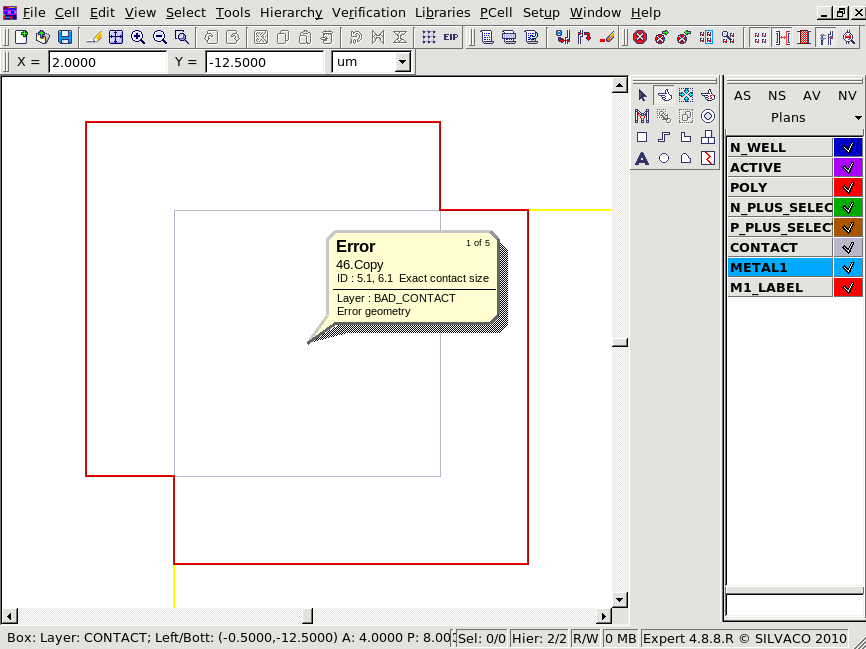
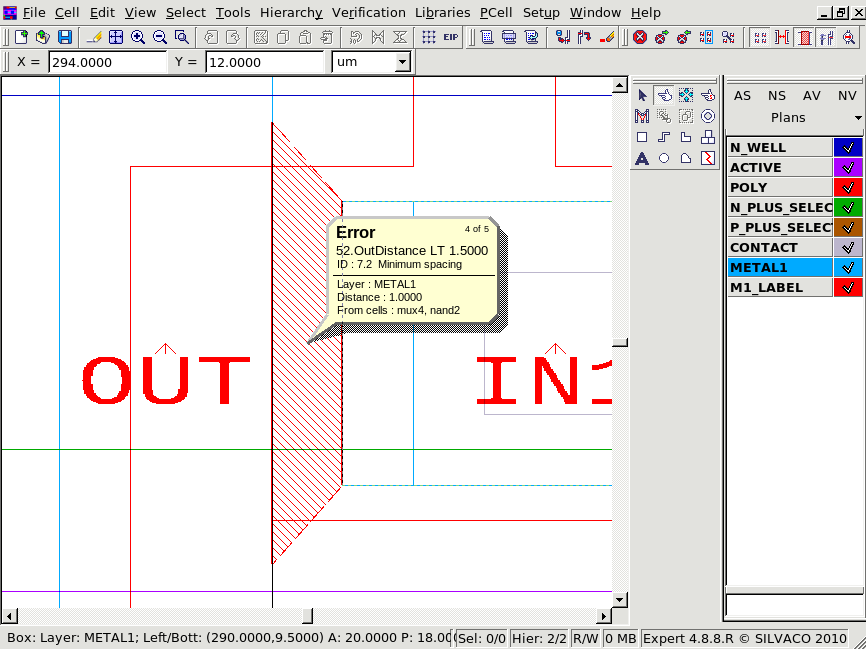
After Loading the DRC errors in the previous step, you can now use the Expert interactive error viewing facility to zoom into, and show explanations of, the errors.
To do this, click Verification->DRC->Errors->First error to show the first error , then Verification->DRC->Errors->Next error to show subsequent errors. There are several options to refine this, for example Verification->DRC->Errors->Filled error markers will show the error bars filled in. See Figure4 and Figure5 .
Note that all of the DRC operations can also be accessed directly from icons in the menu bars, rather than using the cascading menu commands shown in this text. Holding the mouse over an icon shows its function, or you can refer to the manual for a full description of the icons and the commands.
drc_full_flow_28.dsf
											///////////////////////////////////////////////////////////
// DRC script for logic demo
// Layer Mapping and Setup Commands (resolution etc)
// are taken from the technology file.
// When running DRC from Expert, the technology file
// is included in the design database (.eld)
// When running DRC on a gds2 file in batch, the technology
// file (.tcn) must be specified in the batch file
///////////////////////////////////////////////////////////
Update_layout: input=no, technology=no, new=no;
output_error_subsegments: yes;
Merge_Input: on;
////////////////////
// Global Defines //
////////////////////
Substrate: LayerR=&A;
Logicform: PSUB=&A.dif.(N_WELL.or.DEEP_N_WELL);
Logicform: Nactive_in_PWELL=(N_PLUS_SELECT.and.ACTIVE.and.PSUB);
Logicform: ISOPWELL=DEEP_N_WELL.dif.N_WELL;
Logicform: Nactive_in_ISOPWELL=(N_PLUS_SELECT.and.ACTIVE.and.ISOPWELL);
Logicform: Pactive_in_NWELL=P_PLUS_SELECT.and.ACTIVE.and.N_WELL;
Logicform: NWELL_TIE=N_PLUS_SELECT.and.ACTIVE.AND.N_WELL;
Logicform: PSUB_TIE=(P_PLUS_SELECT.and.ACTIVE).DIF.N_WELL;
Logicform: SD_ACTIVE=(P_PLUS_SELECT.and.ACTIVE.AND.N_WELL).or.((N_PLUS_SELECT.and.ACTIVE).DIF.N_WELL);
Logicform: SUB_TIE_ACTIVE=(NWELL_TIE).or.(PSUB_TIE);
//////////////////////////
// Connectivity Defines //
//////////////////////////
Connect: Layer1=N_WELL, Layer2=NWELL_TIE ,LayerC=CONTACT, Options =(I-);
Connect: Layer1=PSUB, Layer2=PSUB_TIE ,LayerC=CONTACT, Options =(I-);
///////////////////
//Rules for N_WELL
///////////////////
//1.1  Minimum width
Select: Relation=overlap, Layer1=N_WELL, layer2=THICK_ACTIVE, LayerR=REG_NWELL, Options=(not);
Width: Layer = REG_NWELL, Limits<10, ID= "1.1  Minimum width";
//1.2  Minimum spacing between wells at different potential
OutDistance: Layer = N_WELL, Limits<9 , Options=(C), ID= "1.2  Minimum spacing between wells at different potential";
//1.3  Minimum spacing between wells at same potential
OutDistance: Layer = N_WELL, Limits<6, Options=(N,C'), ID= "1.3  Minimum spacing between wells at same potential";
//1.4  Minimum spacing between wells of different type (if both are drawn)
Logicform: OVERLAPPING_WELLS=(N_WELL).and.(P_WELL);
Copy: Layer=OVERLAPPING_WELLS,  ID="1.4  Minimum spacing between wells of different type (if both are drawn)";
///////////////////
//Rules for ACTIVE
///////////////////
//2.1  Minimum width
Width: Layer = ACTIVE, Limits<2.5  , ID= "2.1  Minimum width";
//2.2  Minimum spacing
OutDistance: Layer = ACTIVE, Limits<3  , Options=(N), ID= "2.2  Minimum spacing";
//2.3  Source/drain active to well edge
InDistance: Layer1 = SD_ACTIVE, Layer2 = N_WELL, Limits<5  , Options=(T), ID="2.3  Source/drain active to well edge";
OutDistance: Layer1 = SD_ACTIVE, Layer2 = N_WELL, Limits<5  , Options=(T), ID="2.3  Source/drain active to well edge";
//2.4  Substrate/well contact active to well edge
InDistance: Layer1 = SUB_TIE_ACTIVE, Layer2 = N_WELL, Limits<2,  Options=(T), ID="2.4  Substrate/well contact active to well edge";
OutDistance: Layer1 = SUB_TIE_ACTIVE, Layer2 = N_WELL, Limits<2, Options=(T), ID="2.4  Substrate/well contact active to well edge";
//2.5  Minimum spacing between non-abutting active of different implant. Abutting active ("split-active") is illustrated under Select Layout Rules.
Select: Layer1=P_PLUS_SELECT, Layer2=N_PLUS_SELECT, LayerR=PtouchN, relation=touch;
Select: Layer1=N_PLUS_SELECT, Layer2=P_PLUS_SELECT, LayerR=NtouchP, relation=touch;
Logicform: naaodi=(PtouchN.or.NtouchP).and.ACTIVE;
OutDistance: Layer = naaodi, Limits<4, Options=(N), ID= "2.5  Minimum spacing between non-abutting active of different implant. Abutting active (split-active) is illustrated under Select Layout Rules.";
///////////////////
//Rules for POLY
///////////////////
Logicform: TRANSISTOR=(POLY.and.ACTIVE);
//3.1  Minimum width
Width: Layer = POLY, Limits<2  , ID= "3.1  Minimum width";
//3.2  Minimum spacing over field
Logicform: FIELDPOLY=POLY.DIF.ACTIVE;
OutDistance: Layer = FIELDPOLY, Limits<2  , Options=(N), ID= "3.2  Minimum spacing over field";
//3.2.a  Minimum spacing over active
OutDistance: Layer = TRANSISTOR, Limits<2, Options=(N), ID= "3.2.a  Minimum spacing over active";
//3.3  Minimum gate extension of active
InDistance: Layer1 = TRANSISTOR, Layer2 = POLY, Limits<2, ID="3.3  Minimum gate extension of active";
//3.4  Minimum active extension of poly
InDistance: Layer1 = TRANSISTOR, Layer2 = ACTIVE, Limits<3, ID="3.4  Minimum active extension of poly";
//3.5  Minimum field poly to active
OutDistance: Layer1=POLY, Layer2=ACTIVE, Limits<1 , Options=(T), ID="3.5  Minimum field poly to active";
///////////////////
//Rules for N_PLUS_SELECT
///////////////////
Logicform: SELECT=N_PLUS_SELECT.or.P_PLUS_SELECT;
//4.1  Minimum select spacing to channel of transistor to ensure adequate source/drain width
OutDistance: Layer1 = TRANSISTOR, Layer2 = SUB_TIE_ACTIVE, Limits<3, ID= "4.1  Minimum select spacing to channel of transistor";
//4.2  Minimum select overlap of active
InDistance: Layer1 = ACTIVE, Layer2 = SELECT, Limits<1, Options=(T), ID="4.2  Minimum select overlap of active";
//4.3  Minimum select overlap of contact
InDistance: Layer1 = CONTACT, Layer2 = SELECT, Limits<1 , Options=(T), ID="4.3  Minimum select overlap of contact";
//4.4  Minimum select width and spacing
Width: Layer = SELECT, Limits<2 , ID= "4.4  Minimum select width and spacing ";
//4.4  Minimum select width and spacing
OutDistance: Layer = SELECT, Limits<2 , Options=(N), ID= "4.4  Minimum select width and spacing ";
Logicform: BAD_SELECT=N_PLUS_SELECT.and.P_PLUS_SELECT;
COPY: Layer=BAD_SELECT, ID="P-select and N-select may be coincident, but must not overlap";
///////////////////
//Rules for CONTACT
///////////////////
//5.1, 6.1  Exact contact size
SQUARE: Layer=CONTACT, LayerR=BAD_CONTACT, Value=2, Type=EQ, Options=(NOT);
Copy: Layer=BAD_CONTACT, ID="5.1, 6.1  Exact contact size";
//5.2  Minimum poly overlap
InDistance: Layer1 = CONTACT, Layer2 = POLY, Limits<1.5  , Options=(T), ID="5.2  Minimum poly overlap";
//5.3, 6.3  Minimum contact spacing
OutDistance: Layer = CONTACT, Limits<2, Options=(N), ID= "5.3, 6.3  Minimum contact spacing";
//5.4, 6.4  Minimum spacing to gate of transistor
OutDistance: Layer1=CONTACT, Layer2=TRANSISTOR, Limits<1.5 , Options=(T), ID="5.4, 6.4  Minimum spacing to gate of transistor";
///////////////////
//Rules for Active Contact
///////////////////
//6.2  Minimum active overlap
InDistance: Layer1 = CONTACT, Layer2 = ACTIVE, Limits<1  , Options=(T), ID="6.2  Minimum active overlap";
///////////////////
//Rules for METAL1
///////////////////
//7.1  Minimum width
Width: Layer = METAL1, Limits<3  , ID= "7.1  Minimum width";
//7.2  Minimum spacing
OutDistance: Layer = METAL1, Limits<1.5  , Options=(N), ID= "7.2  Minimum spacing";
//7.3  Minimum overlap of any contact
InDistance: Layer1 = CONTACT, Layer2 = METAL1, Limits<1, Options=(T), ID="7.3  Minimum overlap of any contact";
Undersize: layer=METAL1, LayerR=&big_metal1, value=5.0;
Oversize: layer=&big_metal1, LayerR=wide_metal1, value=5.0;
//7.4  Minimum spacing when either metal line is wider than 10 lambda
OutDistance: Layer1=wide_metal1, Layer2=METAL1, Limits<4 , Options=(T), ID="7.4  Minimum spacing when either metal line is wider than 10 lambda";
///////////////////
//Rules for VIA
///////////////////
//8.1  Exact size  2 x 2
SQUARE: Layer=VIA, LayerR=BAD_VIA, Value=2, Type=EQ, Options=(NOT);
Copy: Layer=BAD_VIA, ID="8.1  Exact size  2 x 2";
//8.2  Minimum via1 spacing
OutDistance: Layer=VIA, Limits<3 , Options=(T), ID="8.2  Minimum via1 spacing for 3+Metal Process";
//8.3  Minimum overlap by metal1
InDistance: Layer1 = VIA, Layer2 = METAL1, Limits<1  , Options=(T), ID="8.3  Minimum overlap by metal1";
//8.4  Minimum spacing to contact for technology codes mapped to processes that do not allow stacked vias (SCNA, SCNE, SCN3M, SCN3MLC)  2  n/a  n/a  2  2  n/a
OutDistance: Layer1 = VIA, Layer2 = CONTACT, Limits<1.5 , Options=(T), ID="8.4  Min VIA to contact(no stacked vias)";
//8.5  Minimum spacing to poly or active edge for technology codes mapped to processes that do not allow stacked vias (NOTE
Logicform: PorA=POLY.or.ACTIVE;
OutDistance: Layer1 = VIA, Layer2 =PorA, Limits<2  , ID="8.5  Minimum spacing to poly or active edge(no stacked vias)";
InDistance: Layer1 = VIA, Layer2 = PorA, Limits<2  , ID="8.5  Minimum spacing to poly or active edge(no stacked vias)";
///////////////////
//Rules for METAL2
///////////////////
//9.1  Minimum width
Width: Layer = METAL2, Limits<3  , ID= "9.1  Minimum width";
//9.2  Minimum spacing
OutDistance: Layer = METAL2, Limits<1, Options=(N), ID= "9.2  Minimum spacing";
//9.3  Minimum overlap of via1
InDistance: Layer1 = VIA, Layer2 = METAL2, Limits<1  , Options=(T), ID="9.3  Minimum overlap of via1";
Undersize: layer=METAL2, LayerR=&big_metal2, value=5.0;
Oversize: layer=&big_metal2, LayerR=wide_metal2, value=5.0;
//9.4  Minimum spacing when either metal line is wider than 10 lambda
OutDistance: Layer1=wide_metal2, Layer2=METAL2, Limits<6, Options=(T), ID="9.4  Minimum spacing when either metal line is wider than 10 lambda";
///////////////////
//Rules for POLY2 for Capacitor
///////////////////
Select: Layer1=POLY2, Layer2=POLY, LayerR=POLY2CAP, Relation=Inside;
//11.1  Minimum width
Width: Layer = POLY2CAP, Limits<3, ID= "11.1  Minimum width";
//11.2  Minimum spacing
OutDistance: Layer = POLY2CAP, Limits<3, Options=(N), ID= "11.2  Minimum spacing";
//11.3  Minimum poly overlap
InDistance: Layer1 = POLY2CAP, Layer2 = POLY, Limits<2, Options=(T), ID="11.3  Minimum poly overlap";
//11.4  Minimum spacing to active or well edge
OutDistance: Layer1=POLY2CAP, Layer2=ACTIVE, Limits<2, Options=(T), ID="11.4  Minimum spacing to active or well edge";
OutDistance: Layer1=POLY2CAP, Layer2=N_WELL, Limits<2, Options=(T), ID="11.4  Minimum spacing to active or well edge";
InDistance: Layer1=POLY2CAP, Layer2=N_WELL, Limits<2, Options=(T), ID="11.4  Minimum spacing to active or well edge";
Logicform: POLYCONTACT=POLY.and.CONTACT.DIF.POLY2;
//11.5  Minimum spacing to poly contact
OutDistance: Layer1=POLY2CAP, Layer2=POLYCONTACT, Limits<3, Options=(T), ID="11.5  Minimum spacing to poly contact";
//11.6  Minimum spacing to unrelated metal
DISCONNECT: Layer=GLASS;
DISCONNECT: Layer=METAL1;
Connect: Layer1=POLY2CAP, Layer2=METAL1 , LayerC=CONTACT, Options =(I-);
CONNECT_ORDER:;
OutDistance: Layer1=POLY2CAP, Layer2=METAL1, Limits<2, Options=(C), ID="11.6  Minimum spacing to unrelated metal";
///////////////////
//Rules for VIA2
///////////////////
//14.1  Exact size
SQUARE: Layer=VIA2, LayerR=BAD_VIA2, Value=2, Type=EQ, Options=(NOT);
Copy: Layer=BAD_VIA2, ID="14.1  Exact size";
//14.2  Minimum spacing
OutDistance: Layer = VIA2, Limits<3  , Options=(N), ID= "14.2  Minimum spacing";
//14.3  Minimum overlap by metal2
InDistance: Layer1 = VIA2, Layer2 = METAL2, Limits<1  , Options=(T), ID="14.3  Minimum overlap by metal2";
//14.4  Minimum spacing to via1";
OutDistance: Layer1=VIA2, Layer2=VIA, Limits<2, Options=(T), ID="14.4  Minimum spacing to via1 (no stacked vias)";
//14.5  Via2 may be placed over contact
///////////////////
//Rules for METAL3
///////////////////
//15.1  Minimum width
Width: Layer = METAL3, Limits<6 , ID= "15.1  Minimum width";
//15.2  Minimum spacing to metal3
OutDistance: Layer = METAL3, Limits<4 , Options=(N), ID= "15.2  Minimum spacing to metal3";
//15.3  Minimum overlap of via2
InDistance: Layer1 = VIA2, Layer2 = METAL3, Limits<2 , Options=(T), ID="15.3  Minimum overlap of via2";
Undersize: layer=METAL3, LayerR=&big_metal3, value=5.0;
Oversize: layer=&big_metal3, LayerR=wide_metal3, value=5.0;
//15.4  Minimum spacing when either metal line is wider than 10 um
OutDistance: Layer1=wide_metal3, Layer2=METAL3, Limits<8   , Options=(T), ID="15.4  Minimum spacing when either metal line is wider than 10 um";
///////////////////
//Rules for PBASE (SCNA ONLY)
///////////////////
Logicform: PBASE_CON=PBASE.and.CONTACT;
//16.1  All active contact
SQUARE: Layer=PBASE_CON, LayerR=BAD_PBASE_CON, Value=2, Type=EQ, Options=(NOT);
Copy: Layer=BAD_PBASE_CON, ID="16.1  All active contact";
///////////////////
//Rules for VIA3
///////////////////
//21.1  Exact size
SQUARE: Layer=VIA3, LayerR=BAD_VIA3, Value=2, Type=EQ, Options=(NOT);
Copy: Layer=BAD_VIA3, ID="21.1  Exact size";
//21.2  Minimum spacing
OutDistance: Layer = VIA3, Limits<3, Options=(T), ID="21.2  Minimum spacing";
//21.3  Minimum overlap by Metal3
InDistance: Layer1 = VIA3, Layer2 = METAL3, Limits<2, Options=(T), ID="21.3  Minimum overlap by Metal3";
///////////////////
//Rules for METAL4
///////////////////
//22.1  METAL4 width
Width: Layer = METAL4, Limits<6, ID= "22.1  METAL4 width";
//22.2  METAL4 space
OutDistance: Layer = METAL4, Limits<6, Options=(N), ID= "22.2  METAL4 space";
//22.3  METAL4 overlap of VIA3
InDistance: Layer1 = VIA3, Layer2 = METAL4, Limits<2 , Options=(T), ID="22.3  METAL4 overlap of VIA3";
Undersize: layer=METAL4, LayerR=&big_metal4, value=5.0;
Oversize: layer=&big_metal4, LayerR=wide_metal4, value=5.0;
//22.4  Minimum spacing when either metal line is wider than 10 um
OutDistance: Layer1=wide_metal4, Layer2=METAL4, Limits<6, Options=(T), ID="22.4  Minimum spacing when either metal line is wider than 10 um";
///////////////////
//Rules for THICK_ACTIVE
///////////////////
//24.1  Minimum width
Width: Layer = THICK_ACTIVE, Limits<4  , ID= "24.1  Minimum width";
//24.2  Minimum spacing
OutDistance: Layer = THICK_ACTIVE, Limits<4, Options=(N), ID= "24.2  Minimum spacing";
//24.3  Minimum ACTIVE overlap
InDistance: Layer1 = ACTIVE, Layer2 = THICK_ACTIVE, Limits<4, ID="24.3  Minimum ACTIVE overlap";
//24.4  Minimum space to external ACTIVE
OutDistance: Layer1=THICK_ACTIVE, Layer2=ACTIVE, Limits<4, Options=(T), ID="24.4  Minimum space to external ACTIVE";
Logicform: TGPOLY=THICK_ACTIVE.and.POLY;
//24.5  Minimum poly width in a THICK_ACTIVE gate
Width: Layer = TGPOLY, Limits<3 , ID= "24.5  Minimum poly width in a THICK_ACTIVE gate";
//24.6  Every ACTIVE region is either entirely inside THICK_ACTIVE or entirely outside THICK_ACTIVE
Select: Layer1=ACTIVE, Layer2=THICK_ACTIVE, LayerR=BAD_ACTIVE, Relation=CUT;
Copy: Layer=BAD_ACTIVE, ID="24.6  ACTIVE is entirely inside THICK_ACTIVE or entirely outside THICK_ACTIVE";
///////////////////
//Rules for VIA4
///////////////////
//25.1  Exact size
SQUARE: Layer=VIA4, LayerR=BAD_VIA4, Value=2, Type=EQ, Options=(NOT);
Copy: Layer=BAD_VIA4, ID="25.1  Exact size";
//25.2  Minimum spacing
OutDistance: Layer = VIA4, Limits<3 , Options=(N), ID= "25.2  Minimum spacing";
//25.3  Minimum overlap by Metal4
InDistance: Layer1 = VIA4, Layer2 = METAL4, Limits<2  , Options=(T), ID="25.3  Minimum overlap by Metal4";
///////////////////
//Rules for METAL5
///////////////////
//26.1  Minimum width
Width: Layer = METAL5, Limits<6, ID= "26.1  Minimum width";
//26.2  Minimum spacing to Metal5
OutDistance: Layer = METAL5, Limits<4 , Options=(N), ID= "26.2  Minimum spacing to Metal5";
//26.3  Minimum overlap of Via4
InDistance: Layer1 = VIA4, Layer2 = METAL5, Limits<2, Options=(T), ID="26.3  Minimum overlap of Via4";
Undersize: layer=METAL5, LayerR=&big_metal5, value=5.0;
Oversize: layer=&big_metal5, LayerR=wide_metal5, value=5.0;
//26.4  Minimum spacing when either metal line is wider than 10 um
OutDistance: Layer1=wide_metal5, Layer2=METAL5, Limits<8, Options=(T), ID="26.4  Minimum spacing when either metal line is wider than 10 um";
///////////////////
//Rules for VIA5
///////////////////
//29.1  Exact size
SQUARE: Layer=VIA5, LayerR=BAD_VIA5, Value=3, Type=EQ, Options=(NOT);
Copy: Layer=BAD_VIA5, ID="29.1  Exact size";
//29.2  Minimum spacing
OutDistance: Layer = VIA5, Limits<4, Options=(T), ID="29.2  Minimum spacing";
//29.3  Minimum overlap by Metal5
InDistance: Layer1 = VIA5, Layer2 = METAL5, Limits<1, Options=(T), ID="29.3  Minimum overlap by Metal5";
///////////////////
//Rules for METAL6
///////////////////
//30.1  Minimum width
Width: Layer = METAL6, Limits<6, ID= "30.1  Minimum width";
//30.2  Minimum spacing to Metal6
OutDistance: Layer = METAL6, Limits<5  , Options=(N), ID= "30.2  Minimum spacing to Metal6";
//30.3  Minimum overlap of Via5
InDistance: Layer1 = VIA5, Layer2 = METAL6, Limits<1, ID="30.3  Minimum overlap of Via5";
Undersize: layer=METAL6, LayerR=&big_metal6, value=5.0;
Oversize: layer=&big_metal6, LayerR=wide_metal6, value=5.0;
//30.4  Minimum spacing when either metal line is wider than 10 um
OutDistance: Layer1=wide_metal6, Layer2=METAL6, Limits<10 , Options=(T), ID="30.4  Minimum spacing when either metal line is wider than 10 um";
///////////////////
//Rules for DEEP_N_WELL
///////////////////
//31.1  Minimum Width, Deep_N_Well
Width: Layer = DEEP_N_WELL, Limits<22.5, ID= "31.1  Minimum Width, Deep_N_Well";
//31.2  Minimum Spacing, Deep_N_Well to Deep_N_Well
OutDistance: Layer = DEEP_N_WELL, Limits<50, Options=(N), ID= "31.2  Minimum Spacing, Deep_N_Well to Deep_N_Well";
//31.3  Minimum extension, N_Well beyond Deep_N_Well edge
Logicform: NWELLS=N_WELL.or.DEEP_N_WELL;
InDistance: Layer1 = DEEP_N_WELL, Layer2 = NWELLS, Limits<4, ID="31.3  Minimum extension, N_Well beyond Deep_N_Well edge";
//31.4  Minimum overlap, N_Well over Deep_N_Well edge
OvDistance: Layer1 = N_WELL, Layer2 = DEEP_N_WELL, Limits<0.5, ID="31.4  Minimum overlap, N_Well over Deep_N_Well edge";
//31.5  Minimum spacing, Deep_N_Well to unrelated N_Well
DISCONNECT: Layer=DEEP_N_WELL;
DISCONNECT: Layer=N_WELL;
Connect: Layer1=DEEP_N_WELL, Layer2=DEEP_N_WELL ,Options =(T+);
CONNECT_ORDER:;
OutDistance: Layer1=DEEP_N_WELL, Layer2=N_WELL, Limits<35, Options=(C), ID="31.5  Minimum spacing, Deep_N_Well to unrelated N_Well";
//31.6  Minimum spacing, N+Active in isolated P-well, to N_Well
OutDistance: Layer1=Nactive_in_ISOPWELL, Layer2=N_WELL, Limits<5, Options=(T), ID="31.6  Minimum spacing, N+Active in isolated P-well, to N_Well";
//31.7  Minimum spacing, external N+Active to Deep_N_Well
OutDistance: Layer1=Nactive_in_PWELL, Layer2=DEEP_N_WELL, Limits<30, Options=(T), ID="31.7  Minimum spacing, external N+Active to Deep_N_Well";
//31.8  Minimum spacing, P+Active in N_Well to its Deep_N_Well
OutDistance: Layer1=Pactive_in_NWELL, Layer2=DEEP_N_WELL, Limits<10 , Options=(T), ID="31.8  Minimum spacing, P+Active in N_Well to its Deep_N_Well";