001_vector_plots : Plotting of Simulation waveforms
Requires: SmartSpice & Smartview
Minimum Versions: SMARTSPICE 4.30.5.R + SMARTVIEW 2.34.3.R
The SmartView application allows users to visualize simulation data. SmartSpice provides 2 options to use SmartView. User can use special statement .IPLOT to see simulation results in real-time.
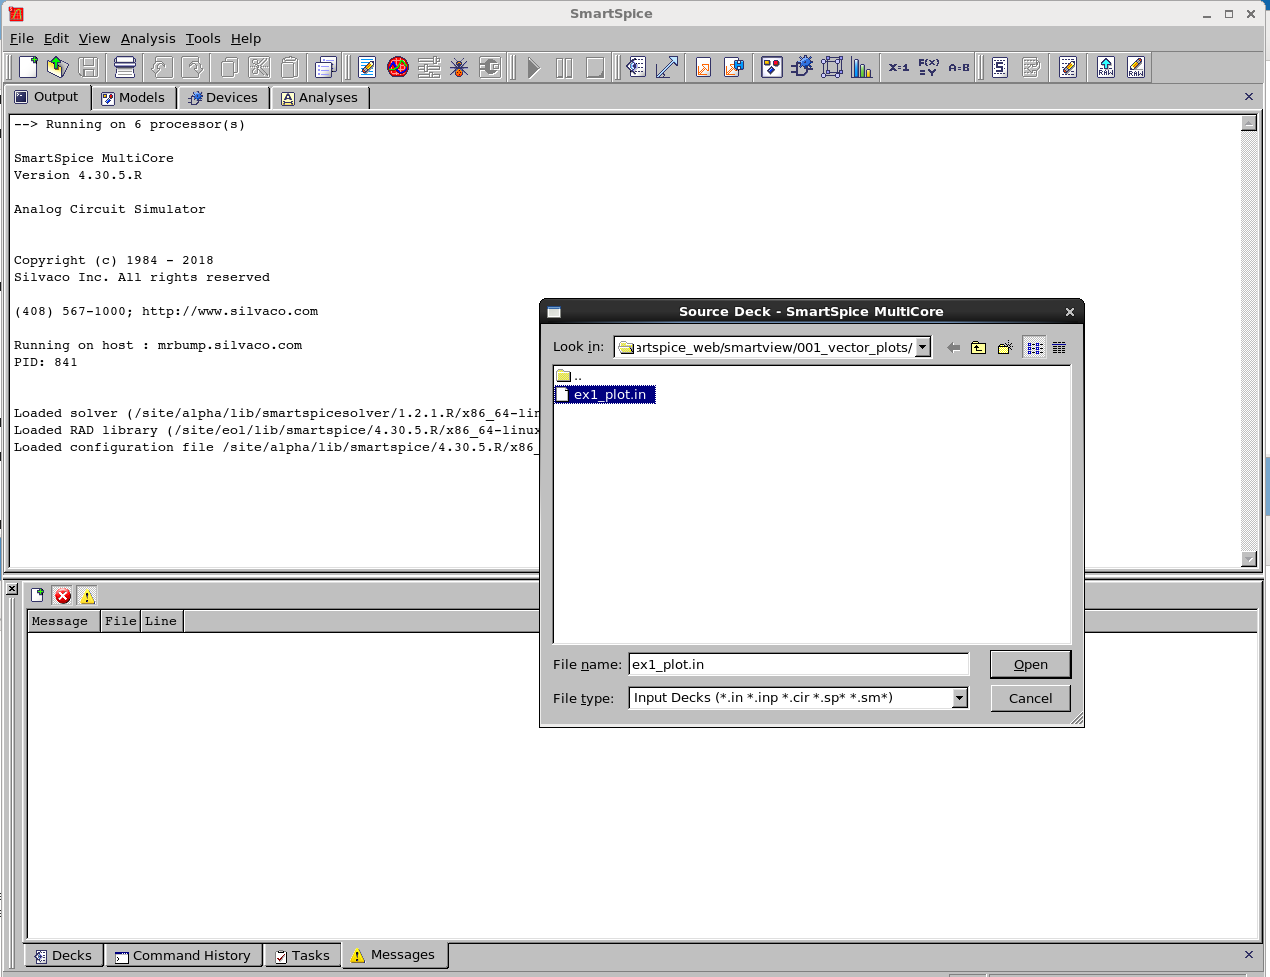
1. Run SmartSpice application
2. Select netlistand source this input deck.
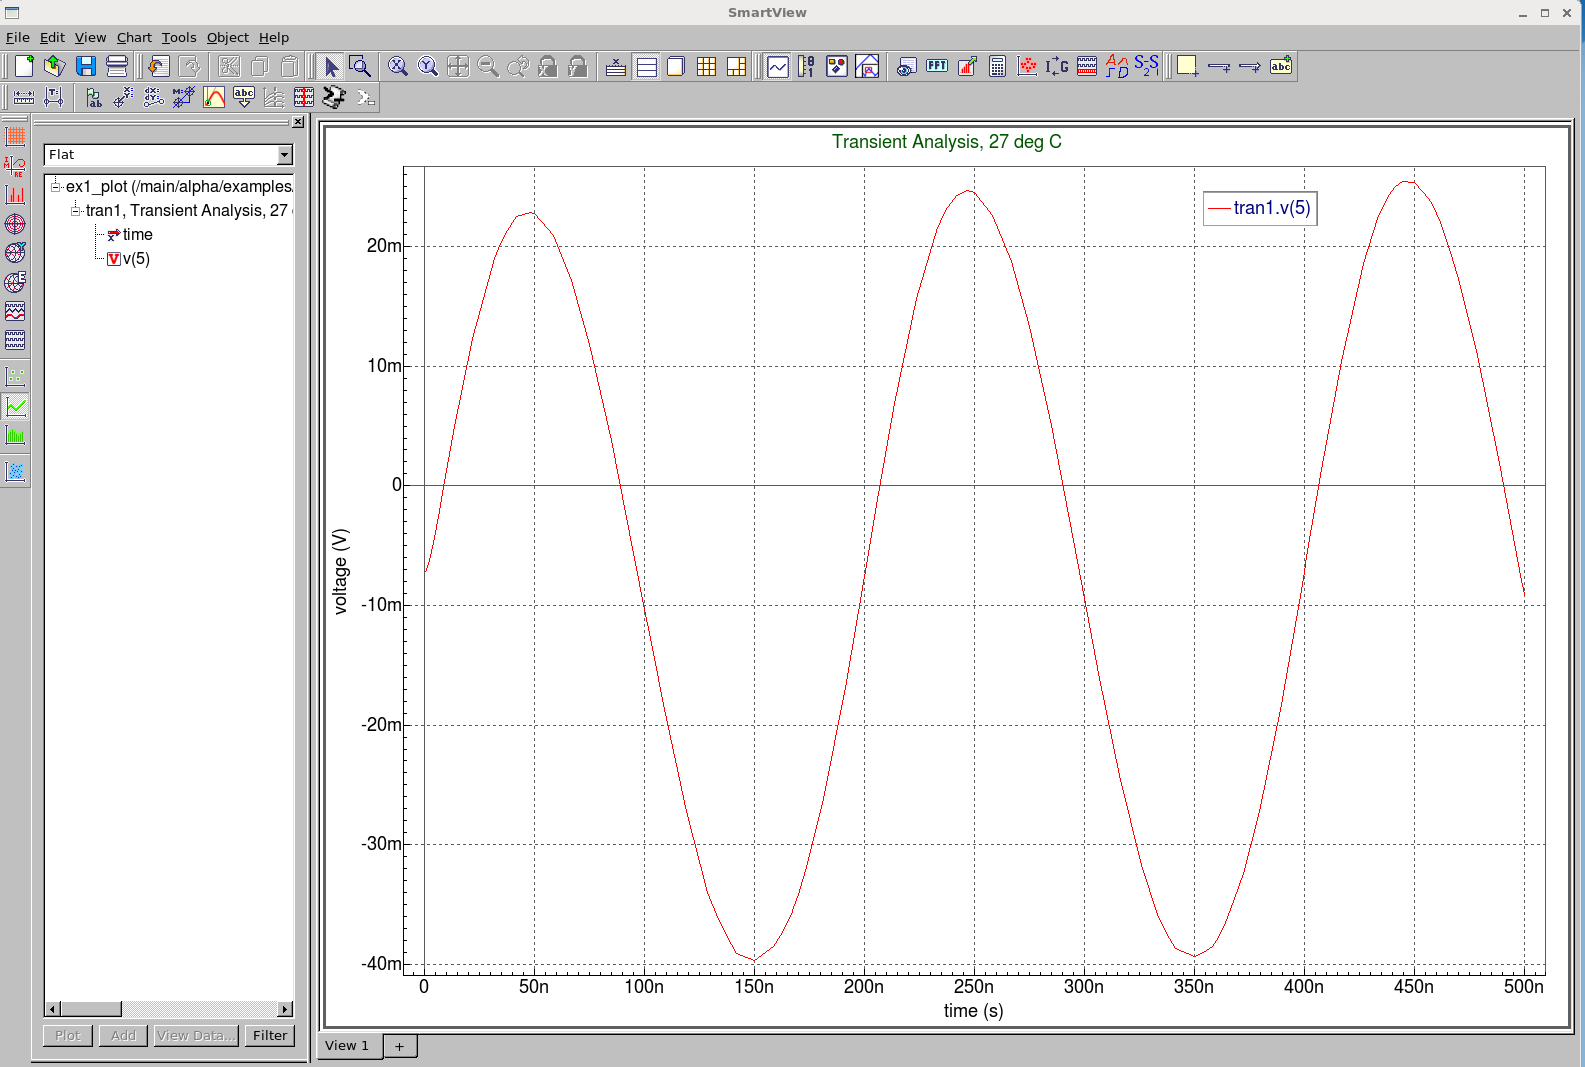
3. SmartView application will start and display plot V(5) vector as a graph.
(bold} 4. To change vector selection the user has to list new vectors in the .IPLOT statement
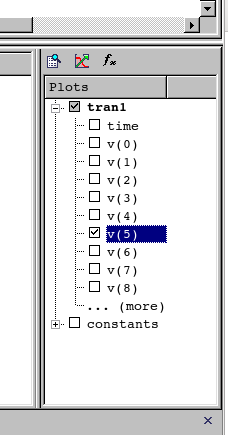
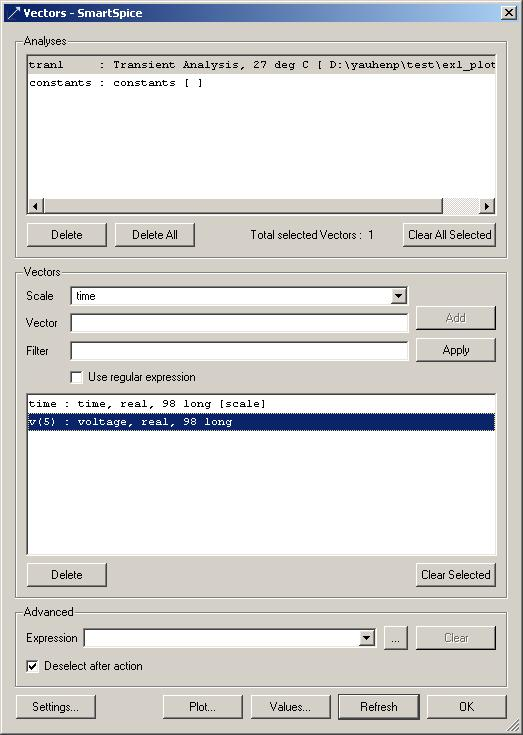
More information about .IPLOT statement can be found in the Users Manual Volume 1, Chapter 2. The user has the ability to manually select certain vectors in GUI after simulation to plot in SmartView without changing the deck. The easiest way to check the vectors is in vector window (usually displays in right-bottom corner of the main window) and press the "Plot" button. The second way is to open "Vectors" dialog (View -> Vectors), select required simulation(s) in the upper list, select required data vectors in the lower list, and press the "Plot" button. The selected vectors will be displayed in SmartView.
The input deck is a SPICE file containing circuit information and both save and plot commands to look at the simulated waveforms.
To run the simulation, press the run button after sourcing input deck. When the simulation completes, the resulting picture is shown in SmartView.
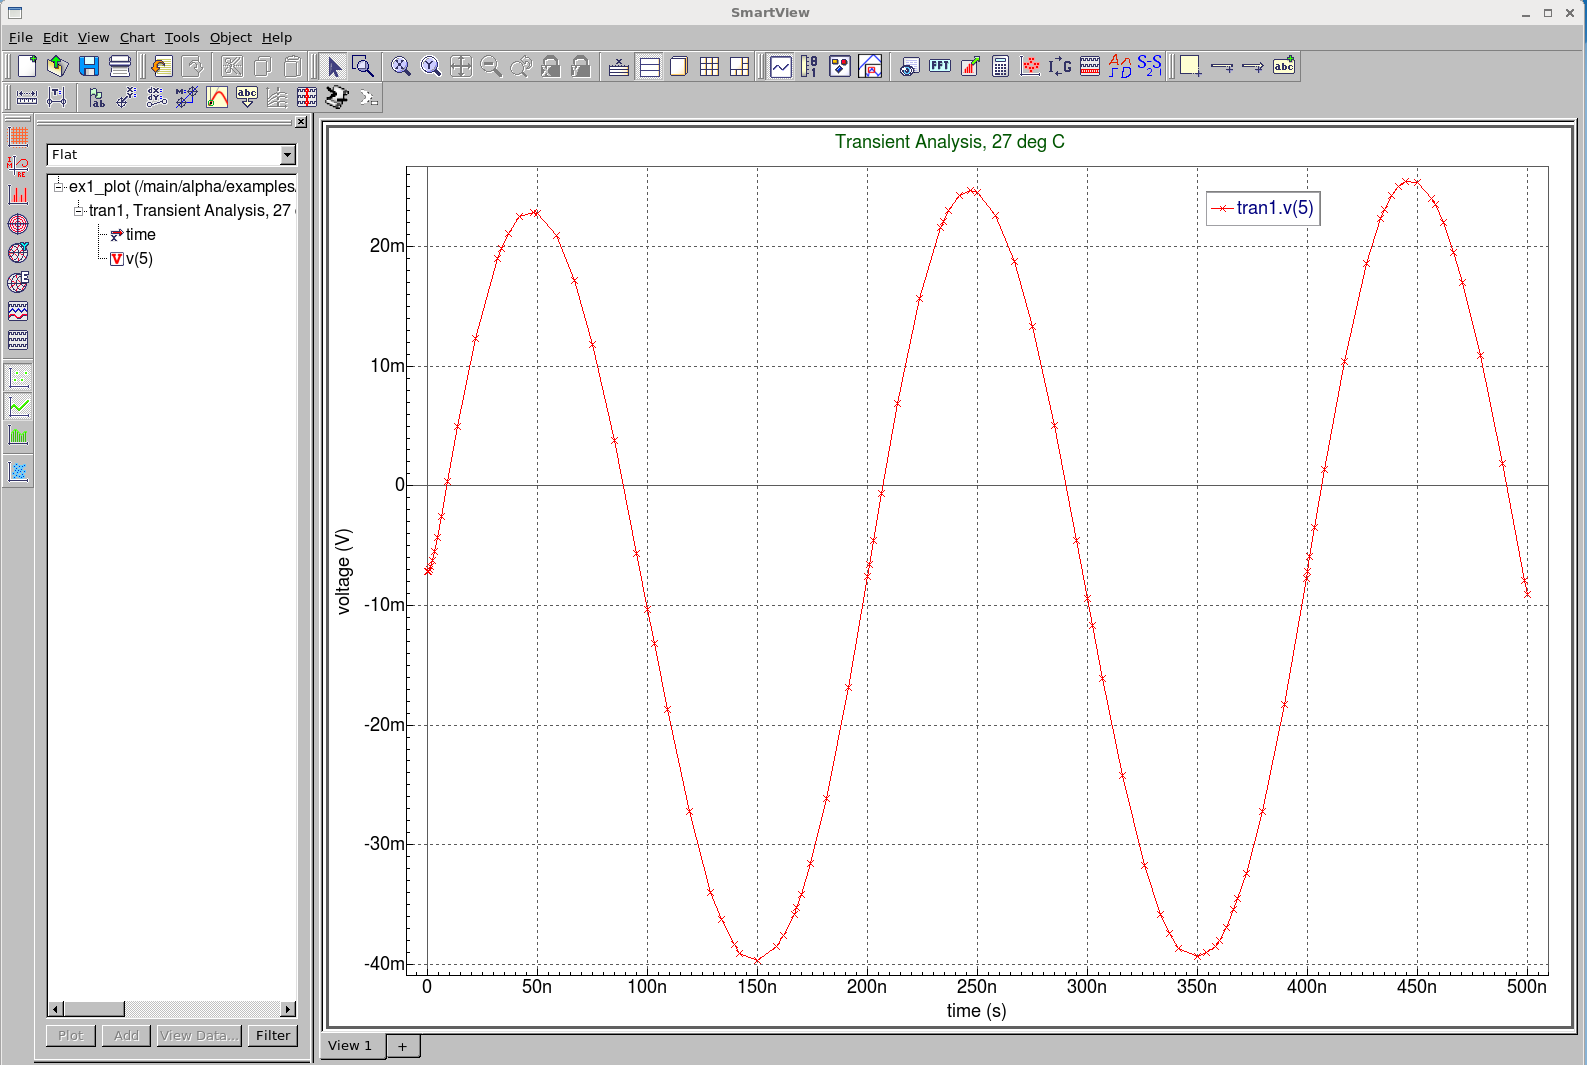
You can turn on the data points of the waveform by clicking the icon in the toolbar on the left. The following plot of waveform plus data points is shown.
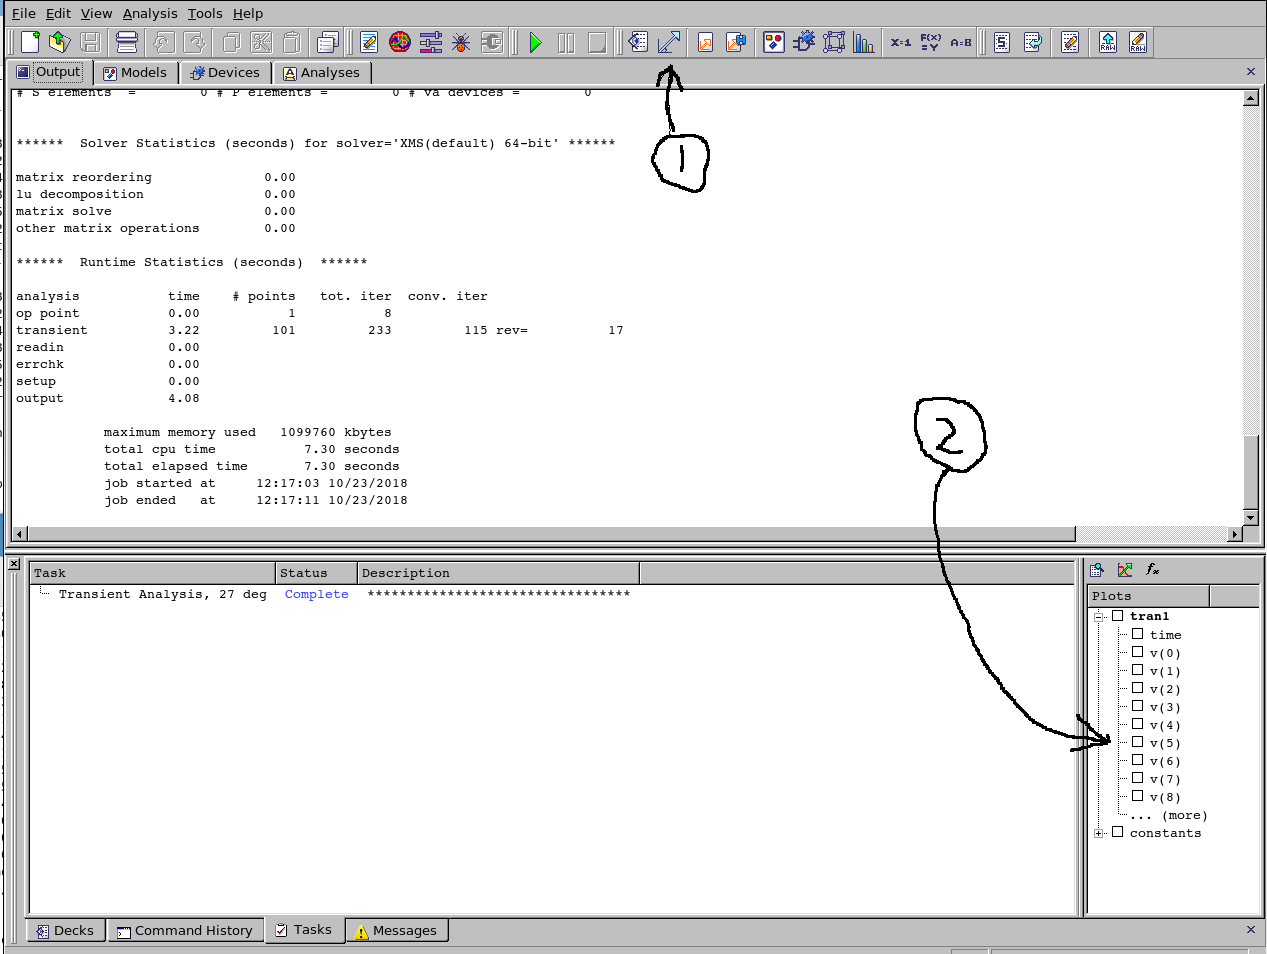
If you do not want to use the .IPLOT to plot automatically you can select vectors from picture case 1 picture or from tool bar icon case 2. vector
ex1_plot.in
											*********************************
*     SMARTVIEW DEMO EXAMPLE    *
*********************************

* Netlist
VIN  1 0  DC 0  SIN(0 0.1 5MEG)  AC 1
VCC  8 0  DC 10
VEE  9 0  DC -12
RS1  1 2  1K
RS2  5 0  1K
RC1  3 8  10K
RC2  4 8  10K
RBIAS  7 8  20K
CLOAD  3 4  5PF
Q1  3 2 6  QNL
Q2  4 5 6  QNL
Q3  6 7 9  QNL
Q4  7 7 9  QNL
*********************************************

*********************************************
* Model definition
.MODEL QNL NPN(BF=80 RB=100 CCS=2PF TF=0.3NS TR=6NS CJE=3PF CJC=2PF
+   VA=50)
*********************************************

.TRAN 5NS 500NS
.save all(v)
*********************************************
* To plot more vectors list them in this statement
.IPLOT V(5)
*********************************************

.OPTIONS ACCT RELTOL=0.001 NOMOD NODECK
.END
001_vector_plots
[an error occurred while processing this directive]