002_mixer : RF Mixer Schematic Simulation
Minimum Required Versions: Gateway 2.12.8.R, SmartSpiceRF 1.6.3.R
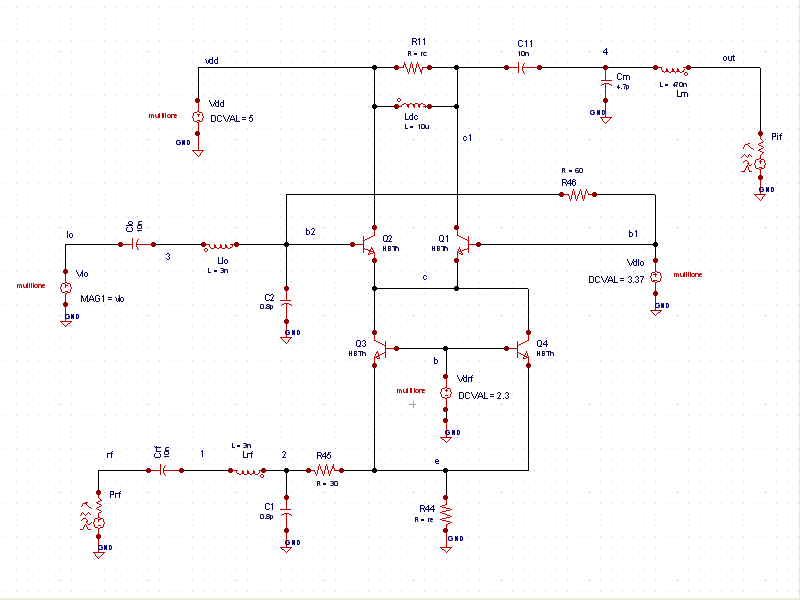
RF Example 2 is a mixer design ( mixer.png ). The three ports of the mixer are the Local Oscillator port (LO), the Radio Frequency (RF) port, and the Intermediate Frequency (IF) port. The LO port, used exclusively as an input port, acts as a gate in such a way that when the voltage on the port is high, the mixer is considered "on". When the voltage is low, the mixer is considered "off". The control file for this design ( mixer.ctr) shows that there will be 2 separate runs performed on the mixer. The first simulation will calculate the measurement for the noise figure. Specifically, the NFssb, or single-sideband noise figure will be examined. After the first simulation completes, the .ALTER statement is processed along with all the statements that follow it. At this point, the second simulation is performed which is the measurement for harmonic distortion.
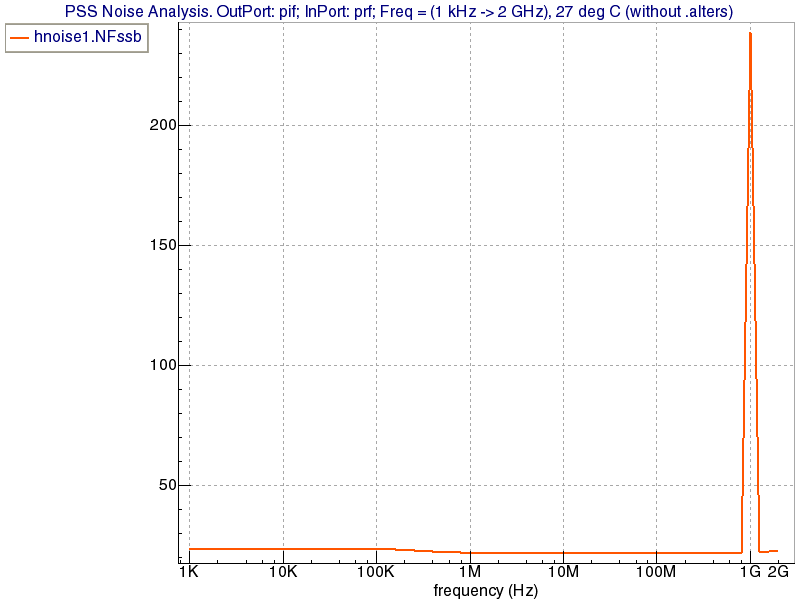
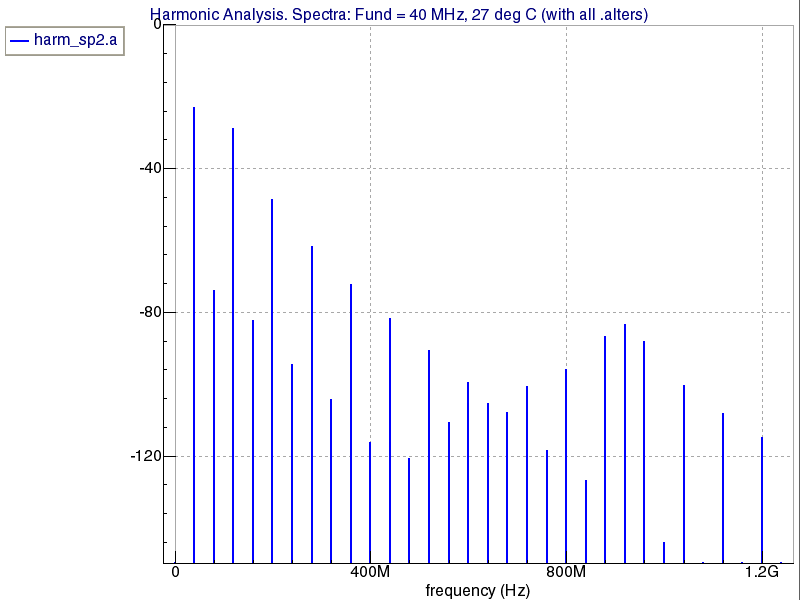
When the schematic is opened and the Run button is pressed, the simulation begins and when it is complete, the SmartView window appears. From the data browser, choose the noise analysis and expand the analysis to show the vectors. Choose the NFssb vector and drag it into the display. The plot of the NFssb vector ( NFssb.png ) shows the single sideband noise figure over the frequency range. After deleting that plot, the harmonic distortion plot can be generated. From the SmartView data browser window, expand the harmonic spectral analysis and choose the vector named 'a'. This vector was created in the control file and specified to be the dB of the output node. Drag the vector into the chart window and the spectral data is shown ( dbout.png ). NOTE: the y axis is scaled to a minimum of -150 and a maximum of 0.
mixer.ctr
											*
.include HBT1.mod
.param  re=450 rc=1k
.param kfn = 1.e-24 sh = 0
.param prf=-30_dBm
.param vlo=316.2m
*
Vlo lo gnd  mag1=vlo
*-------- Noise Figure Measurement -----
.HNOISE Pif Prf
+   DEC 10 1kHz 2GHz
+   fund=1GHz
+   refSB=-1
+   Kmax=10
+   Annotate=3
+   WAVES

.ALTER
*
.include HBT1.mod
.param  re=450 rc=1k
.param kfn = 1.e-24 sh = 0
.param prf=-30_dBm
.param vlo=316.2m
.let a=vdb(out)


*-------- Harmonic Distortion Measurement -----
.HARMONIC
+ FUND=40MegHz nharm=31
+ annotate=3
+ waves

.MEASURE HARM_SP dbH2 FIND vdb(out) AT=80MegHz
.MEASURE HARM_SP dbH4 FIND vdb(out) AT=400MegHz
.MEASURE HARM_SP dbH6 FIND vdb(out) AT=600MegHz
.MEASURE HARM_SP modH4 FIND vm(out) AT=160MegHz
.MEASURE HARM_SP modH6 FIND vm(out) AT=240MegHz

.MEASURE HARM_SP THD EXPR VAL=db10(modH4*modH4+modH6*modH6)-dbH2'